
Draft for review. The article content in this guide is migrated and unchanged. The introduction and the short lead-in paragraph at the top of each section are newly written and are marked “New text — pending review” — nothing in them has been approved yet.
Options work runs deeper than any other part of the platform, and this guide takes it in order: reading the chain, using the strategy templates, building a position, analyzing it, adjusting it, and testing ideas in Backtest before risking anything.
You can read straight through, or use the contents list to jump to what you need. Every section below is also a standalone article — the “Open as article” link under each one takes you to it on its own page, if you want to bookmark or share just that piece.
Option Chain Functionality
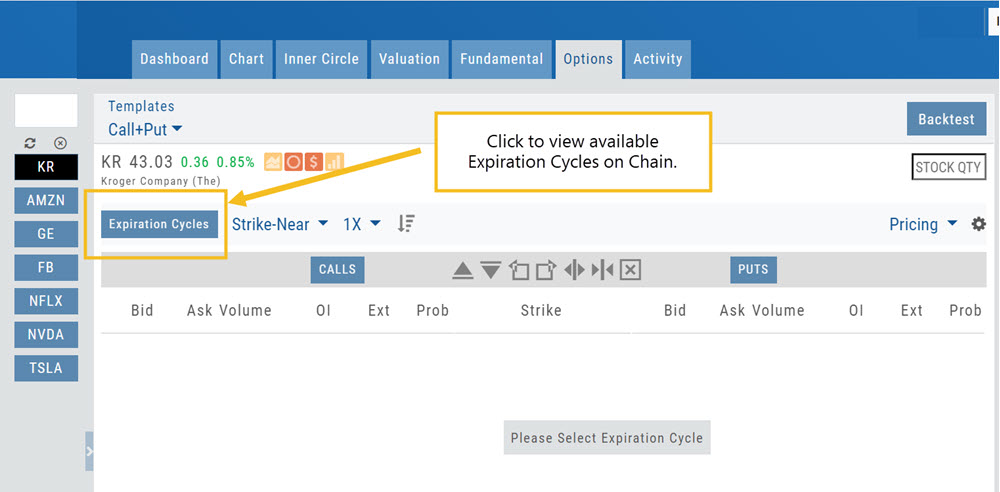
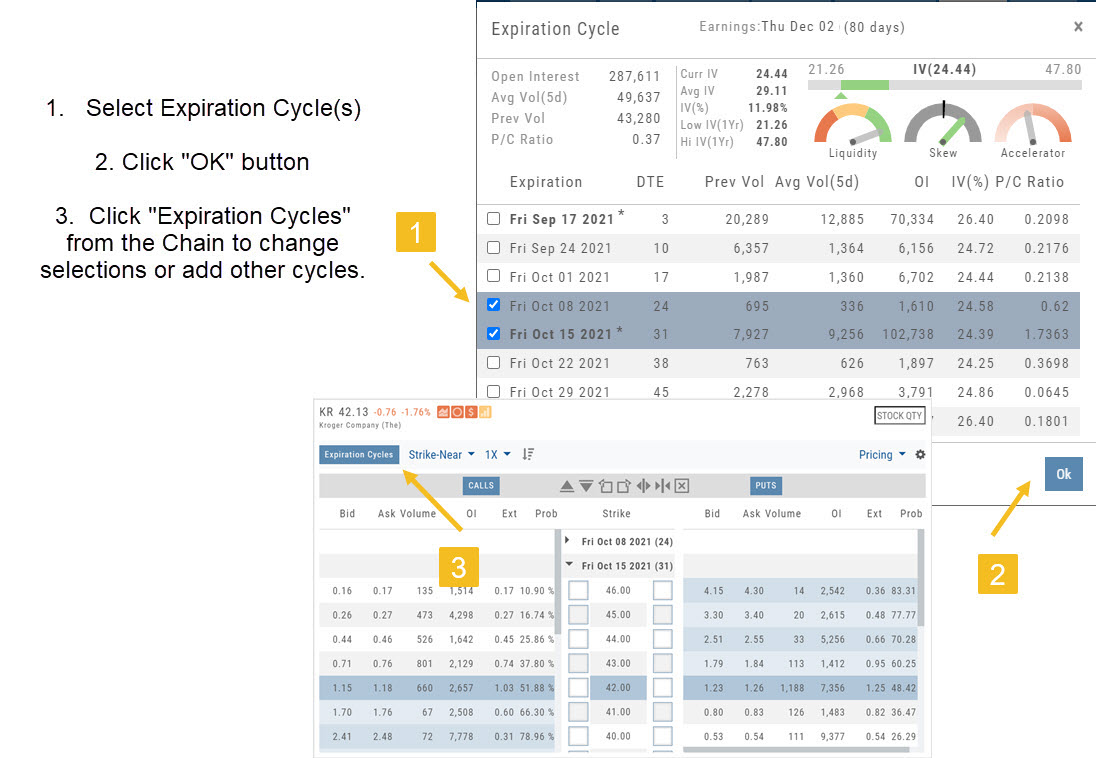
Research>Option Tab, click on “Expiration Cycle” for the “Call+Put”, “Calls” or “Puts” view.
Option Chain Expiration Cycles
The Option Chain Expiration Table gives you control of selecting which Expiration Cycle(s) you want to view.
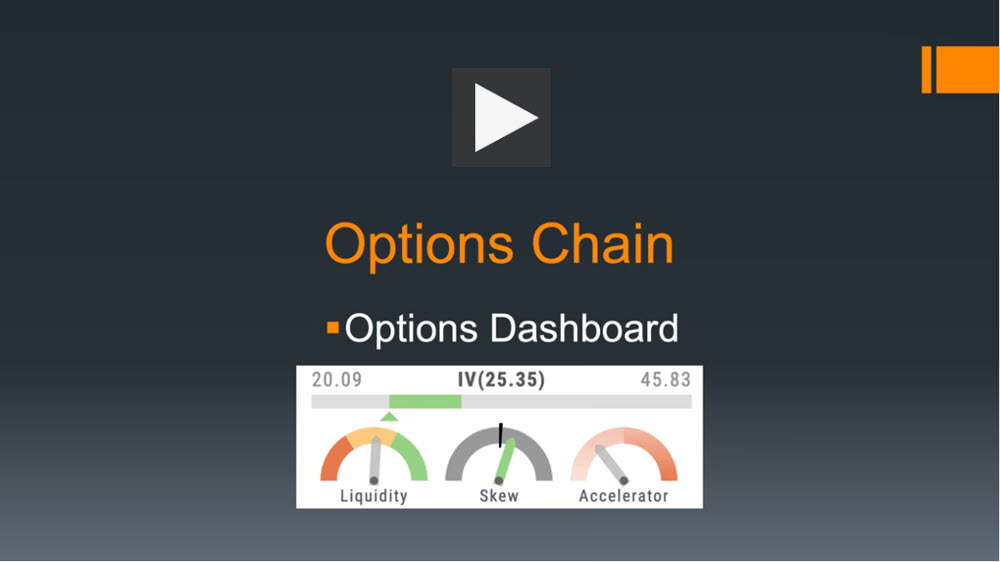
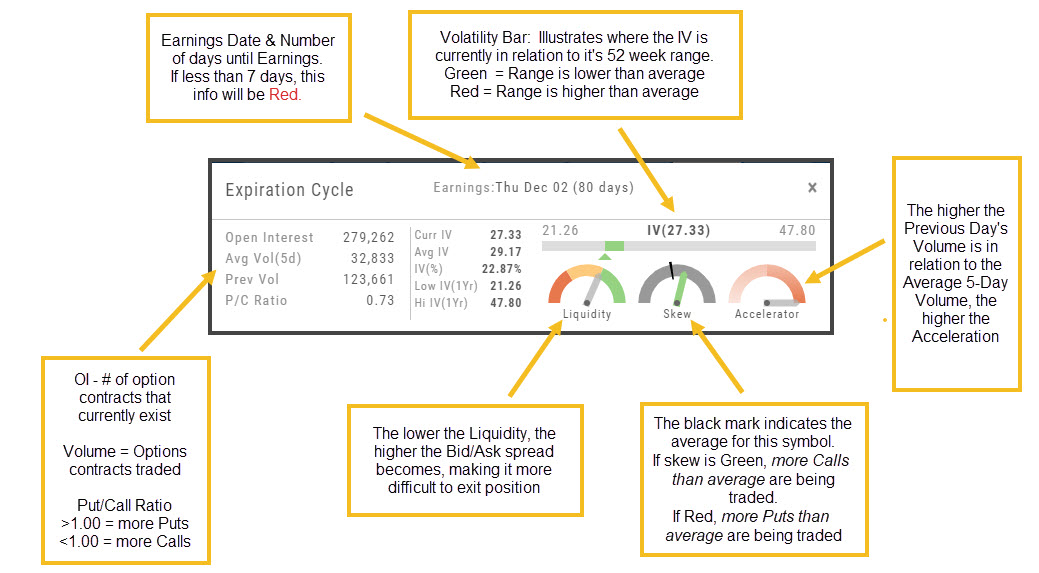
The Option Dashboard provides a wealth of pertinent information to make informed decisions easier.
See below for more detail
Expiration Cycles: All available options will be displayed. Monthly Options are indicated with an asterisk
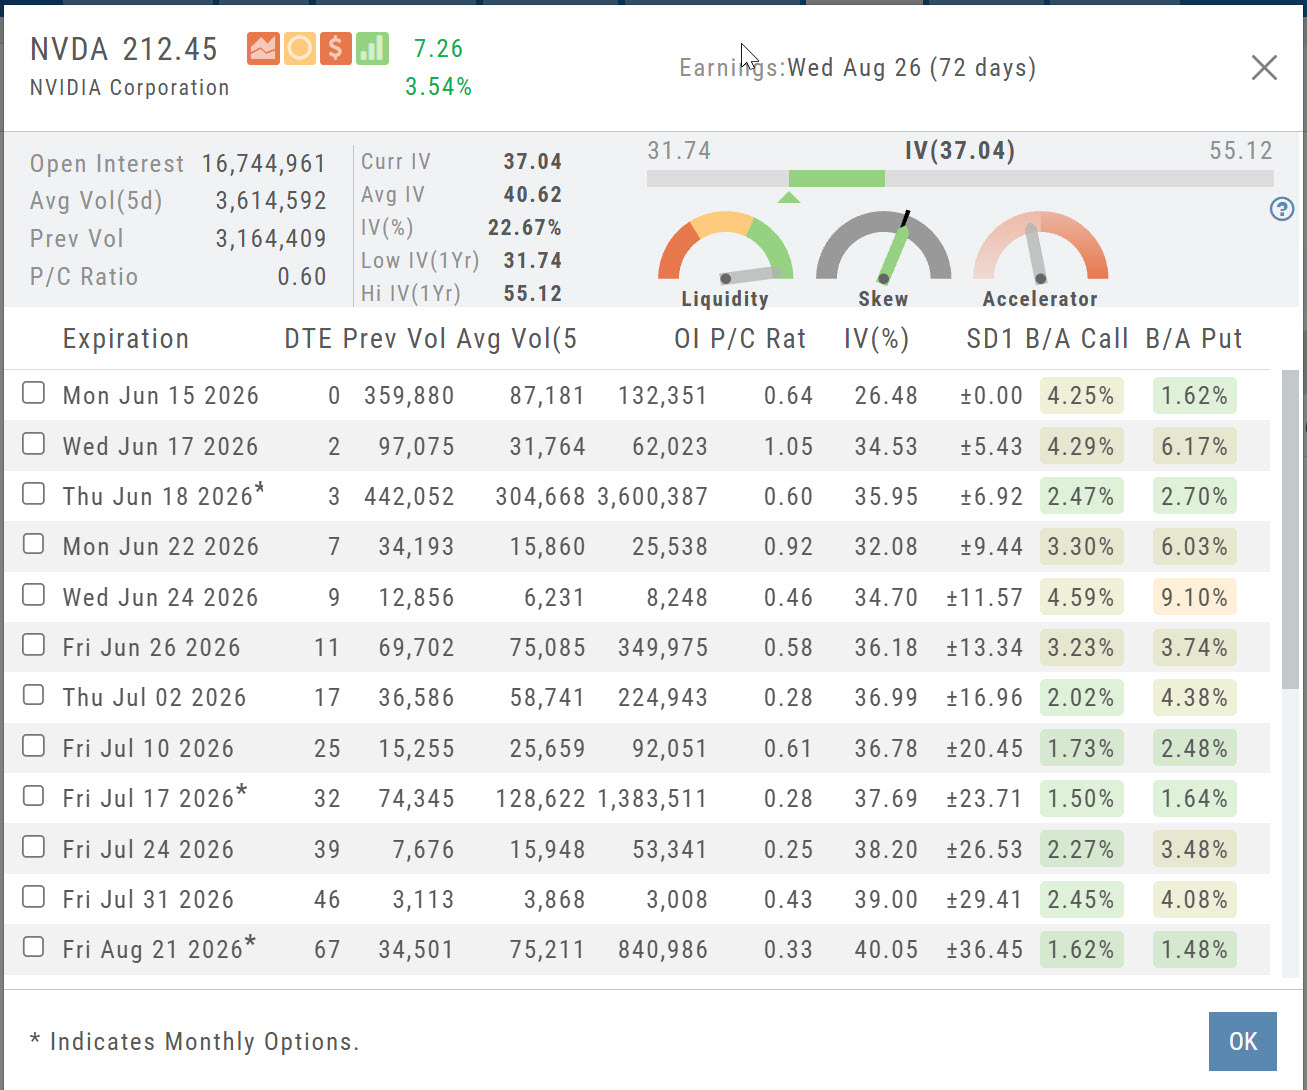
Select Expiration Cycles
Click ‘OK”
Chain will display for selected
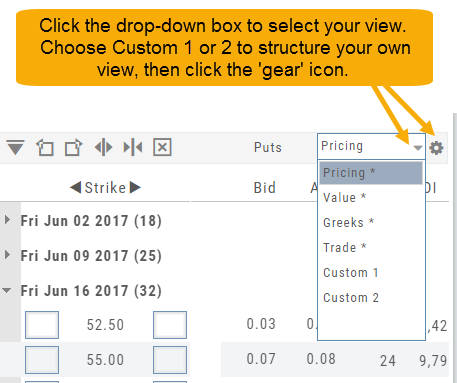
Create Customized Option Table Views
Create, edit and re-create custom Option Views.
This feature allows you to create up to two customized Option Tables. Add/remove categories or even change the order of category columns by clicking on the criteria, then drag/drop it to the new location.
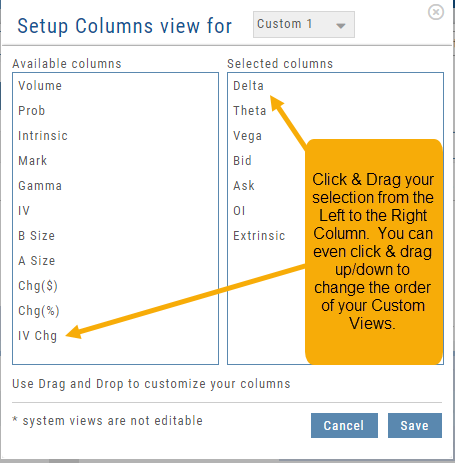
Click ‘save’ and you’re done.
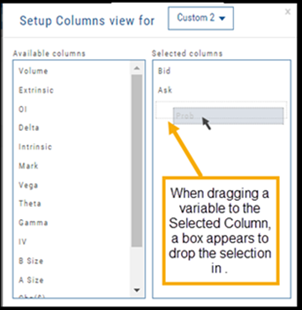
Note: You can change the order of your variables you select by clicking/dragging the variable up or down. The custom views can be changed at any time – to adjust to the user’s needs.
Strategy Metrics on the Option Chain
Build a multi-leg strategy on the Option Chain and the figures that decide whether it is worth taking are calculated as you go.
The callout bar sits directly beneath the legs and recalculates as you add, remove or reprice them — so you can weigh a structure before committing to it. Below it, the payoff diagram plots profit and loss across the price range, with a separate curve for each date between today and expiration.
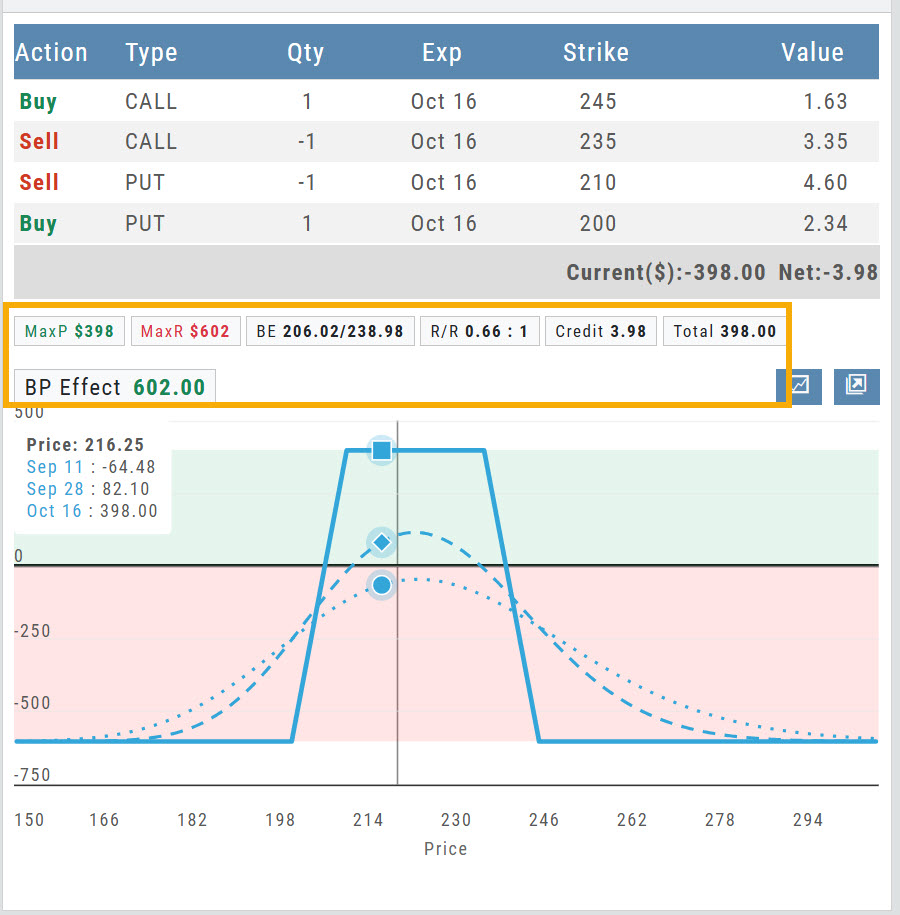
What the callout bar reports
| Field | What it shows | This example |
|---|---|---|
| MaxP | Maximum profit — the most the position can make. | $398 |
| MaxR | Maximum risk — the most it can lose. | $602 |
| BE | Breakeven price on each wing, lower and upper. | 206.02 / 238.98 |
| R/R | Reward measured against risk. | 0.66 : 1 |
| Credit | Net premium received — shown as Debit when you pay to enter. | 3.98 |
| Total | Cost to enter the trade; here, the credit collected. | 398.00 |
| BP Effect | Buying power the position ties up while it is open. | 602.00 |
Strategy templates
New text — pending review
Templates build a strategy for you and keep its structure honest. These pages cover the template elements, snapshots, the storyboard, performance channels, and the delta/theta display.
Strategy Template
On Research>Option Tab, click the down arrow next to the default “Call+Put” view in the upper left corner of the window to access the Strategy Templates:
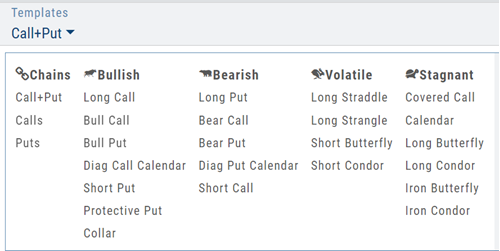
Select your Strategy and set up the position:
Quantity, Expiration Date, Strikes
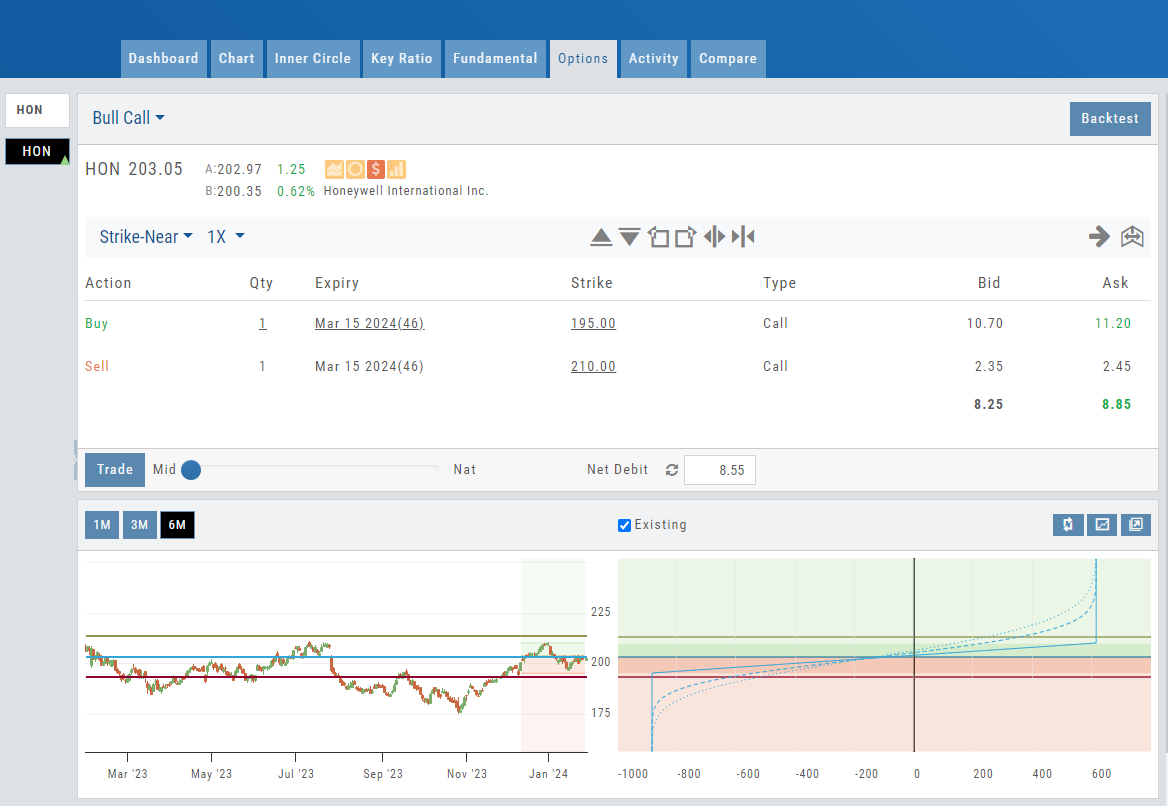
Elements of the Template
The Trade Finder Templates are designed to allow you to ‘visually trade’.
When evaluating a position, a Bull Put for example, the template automatically sets up the trade. You can use the rolling icons to adjust the position: Roll the position up/down, roll out the time frame, adjust the strikes, etc. You can even adjust the Net Credit(Debit) of the trade in an attempt to get a more favorable entry cost/credit.
The Performance Channels show the profit/loss of the position.
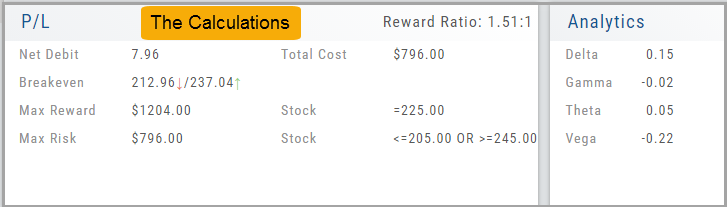
The P/L summary at the bottom left of the screen shows the Risk/Reward ratio, Net/Total Credit (Debit),the break-even stock price point, the max reward/max risk with corresponding stock price.
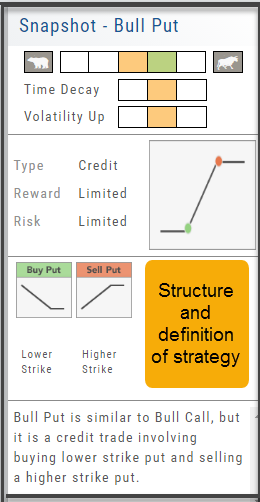
A snapshot on the right side of the screen, provides a visual structure of the strategy, what market conditions are favorable to the trade, whether volatility and/or time positively, negatively or is neutralized by the strategy.
Greeks and Volatility are also shown.
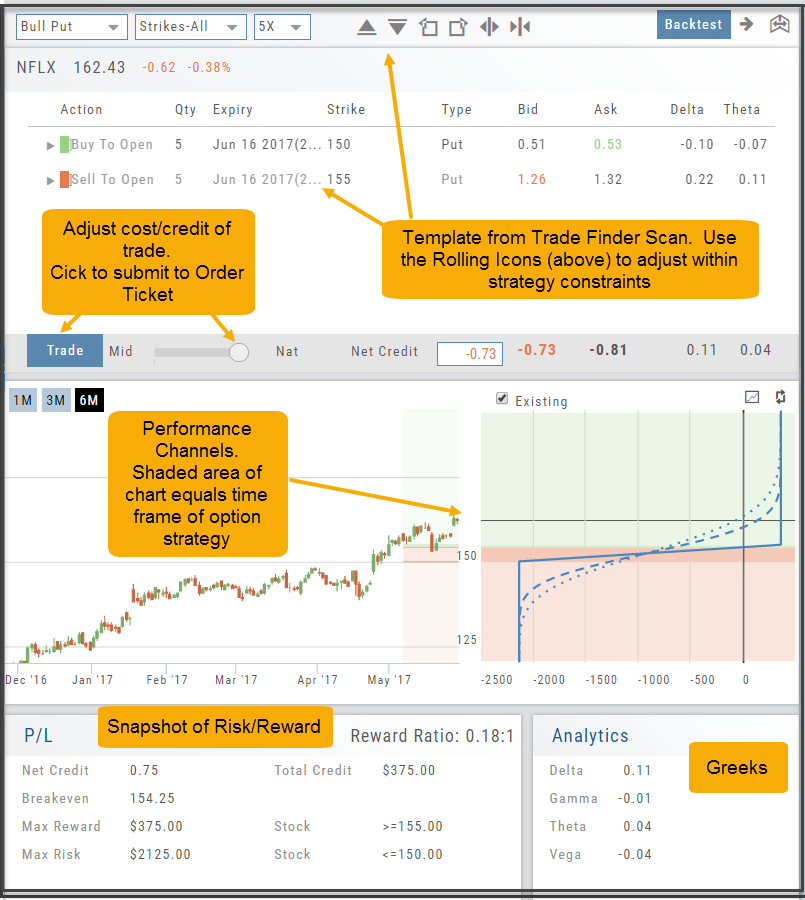
Once satisfied with the position set-up, click ‘Trade’ and the order will auto-fill in the “Order Ticket” of your brokerage account.
Important! While adjustments to the template may be made, the system limits what can be changed in order to stay within the constraints of the strategy. This safety measure ensures you stay in the type of trade you intend to be in.
Strategy Snapshot
It’s the “Cliffnotes” version of your strategy
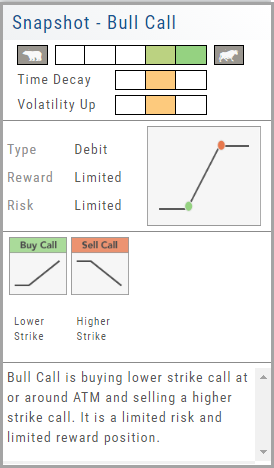
Each strategy template provides a quick reference for the construction and application of the strategy. The snapshot shows:
- what the strategy outlook is on the color-coded range from ‘Very Bearish’, ‘Mildly Bearish’, ‘Neutral’, ‘Mildly Bullish’ or ‘Very Bullish’.
- what effect ‘time decay’ and ‘volatility’ has on the strategy: ‘Increase’, ‘Neutral’ or ‘Decrease’.
- debit or credit trade
- risk & reward level
- strategy structure
- an overview summary of the strategy
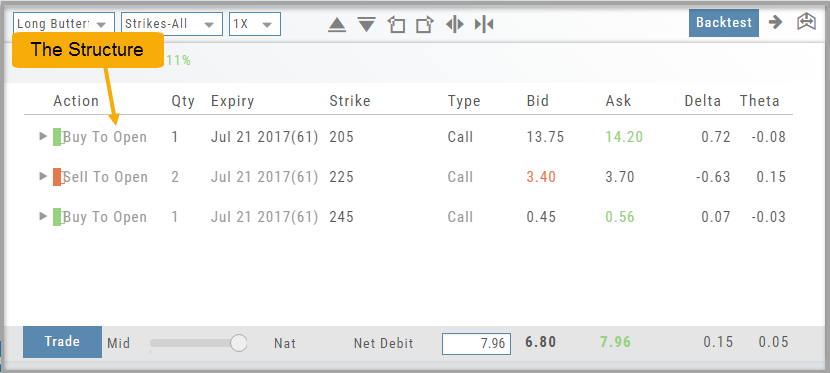
Storyboard of the Strategy
We also display a storyboard-like view of the selected strategy. It is a combination of chart, risk graph, and performance channel constructed within one panel.
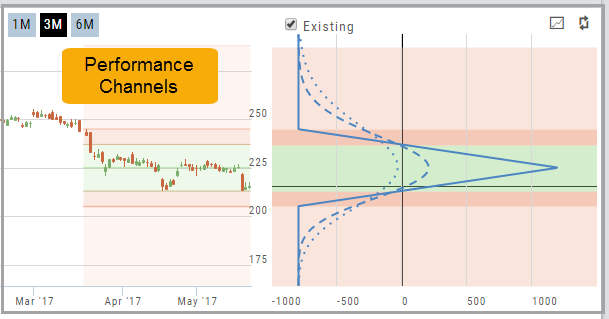
This storyboard gives you the full picture of the position: The Structure, Performance Channels and Calculations.
Performance Channels
Performance Channels can assist in visual analysis across both the P/L Graph and the Chart.
- Dark Green – Stock movement affects gain
- Light Green – At maximum gain
- Dark Red – Stock movement affects loss
- Light Red – At maximum loss
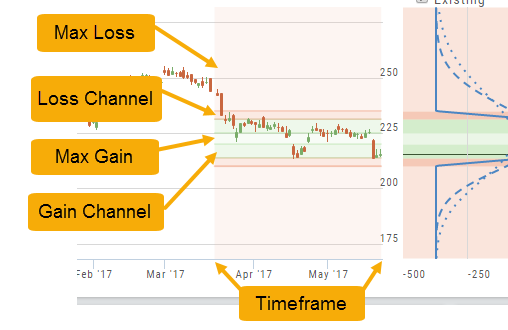
The width of the channel on the chart represents the timeframe of the trade. If options expire in 30 days, the channel will display back 30 days on the chart. This give a visual reference for the time frame of the trade.
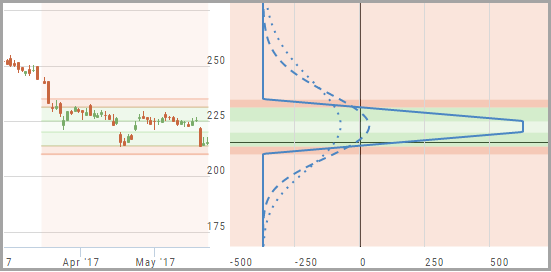
Note: Channels are displayed based on expiration of the trade. Past performance is not indicative of future results. Performance channel date orientation is for reference only.
Delta & Theta Display on Template
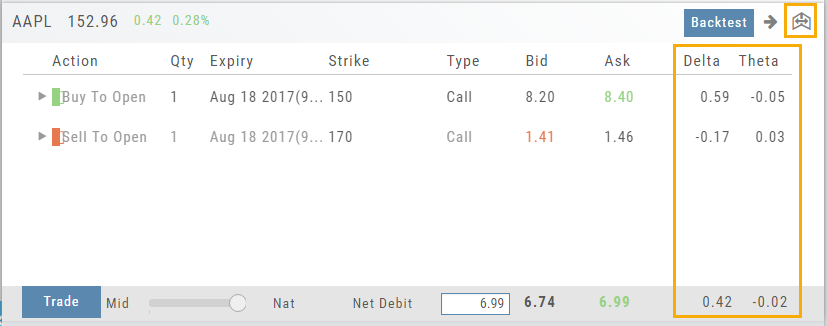
You can expand the template to show Delta and Theta for the individual legs as well as the totals for the trade by clicking the  icon on the upper right part of this screen.
This can help for faster evaluation and better positioning of the trade.
Price Slices – Premium Feature
Price Slices
Price Slices allow users to view theoretical outcomes of option positions, while providing the flexibility of changing data points, such as entry price or what the results will be if the stock price moves a specific dollar or percentage amount.
This feature is helpful with building discipline on when to exit a trade if it goes against you.
This feature is accessible when using the Strategy Templates on the Research>Option Tab
The default starting points include:
- Entry Point – shown in Blue in our example.
- High Point – considered Target or Resistance point – shown in Green.
- Low Point – considered Stop or Support point – shown in Red
(Up to 7 Price slices can be added for additional evaluation. See below for more details)
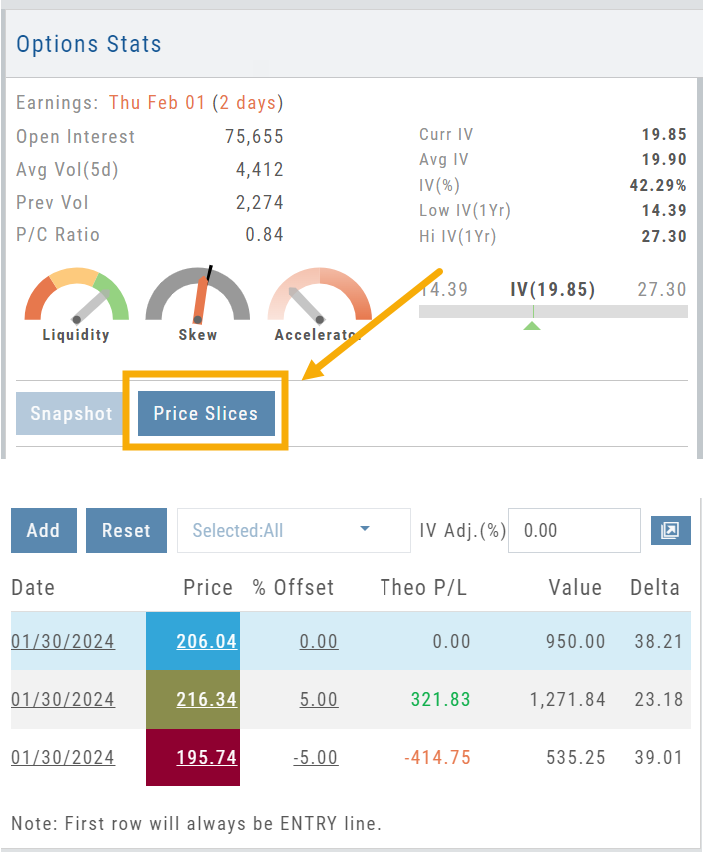
On the right side of the Strategy Template screen, click the  button to display the default settings.
Using our example:
Entry point is $206.04 (Current Stock Price) shown in Blue
High point – defaults to 5% above Entry: $216.34, shown in Green/Gold
Low point – defaults to 5% below Entry: $195.74, shown in Red
The values are for ‘today’: what the Profit or Loss would be if the stock price were the High or Low price.
The Date, Price and/or % Offset can be manually adjusted, as indicated by the underline – to view different scenarios.
Price Slices – Adjust the % Offset Value
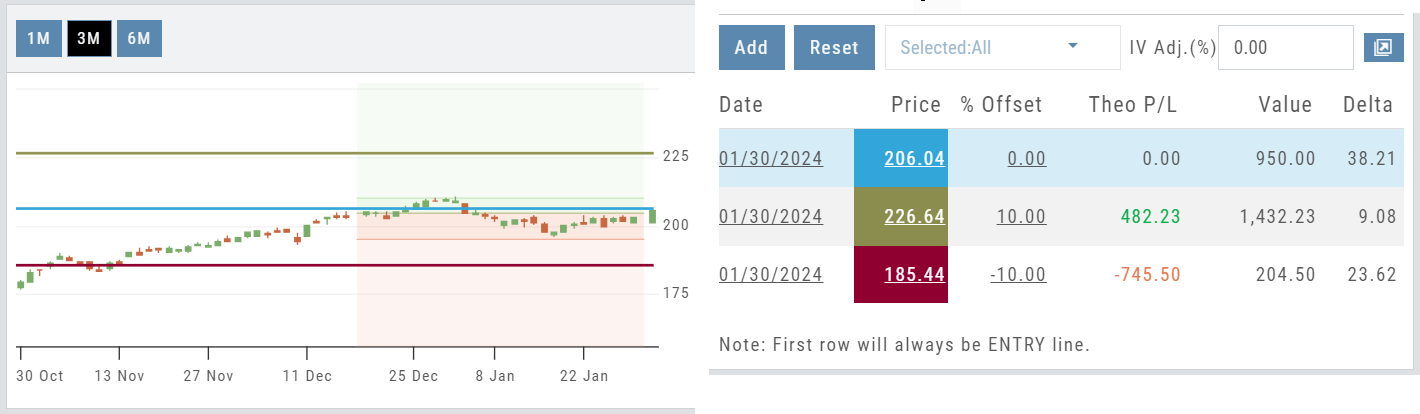
% Offset values were manually changed to 10% and -10%.
The lines on the graph are dynamically updated
Price Slices – Adjust the lines
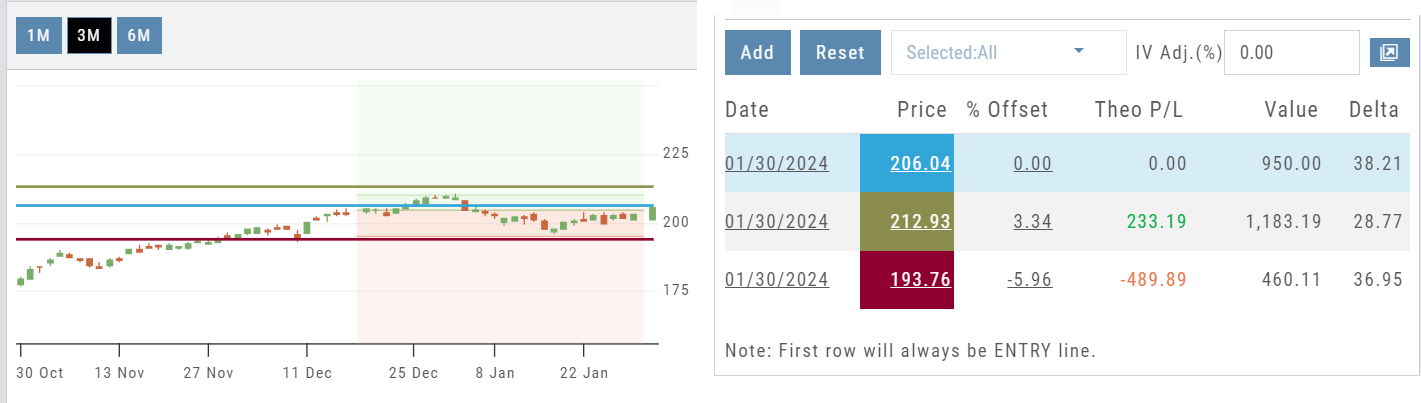
In this example, the Top and Bottom lines were adjusted on the graph itself.
The new placement dynamically updated the values on the right.
Price Slices – Add, Reset, Go Big
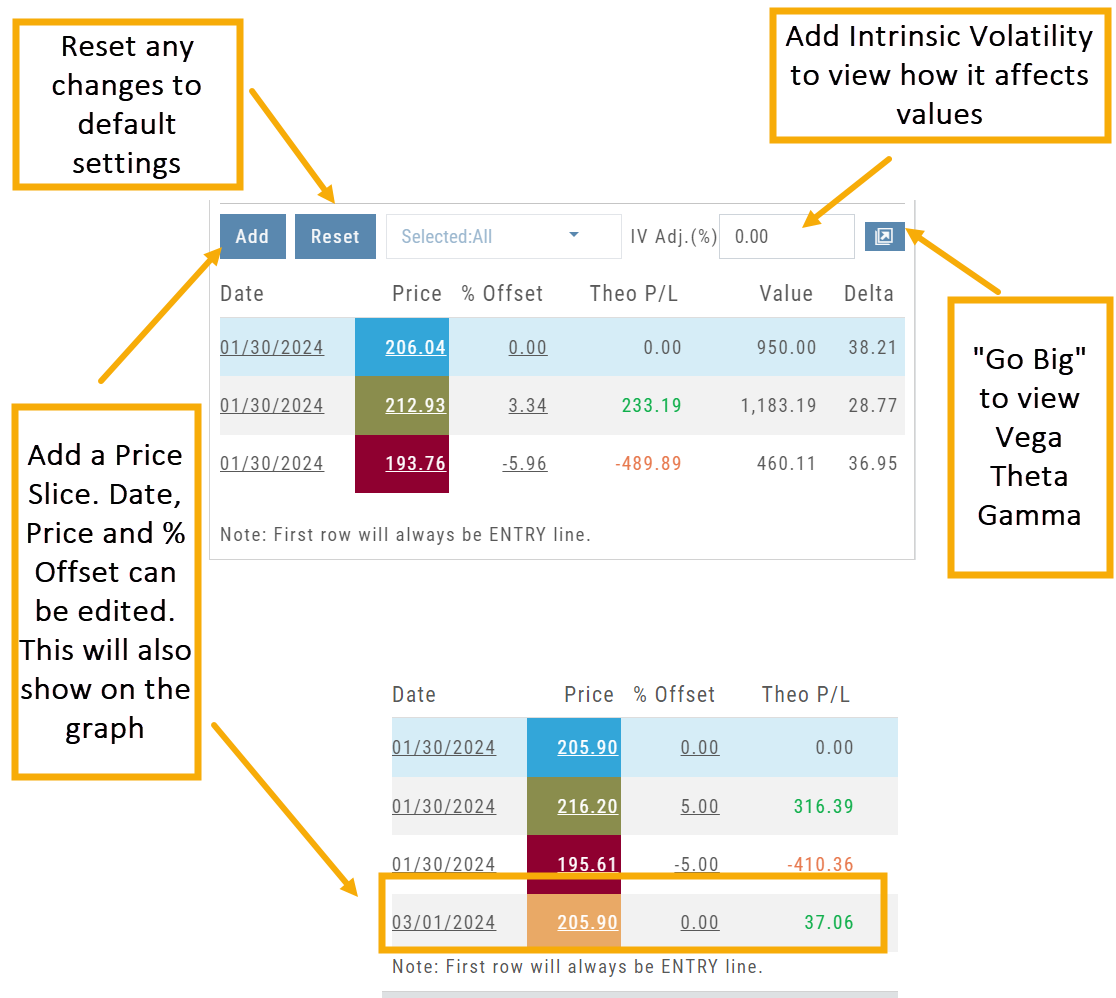
Building and placing a trade
New text — pending review
Several ways to get from an idea to a working order — from the chain, from the templates, or straight from analysis.
Entering a Position
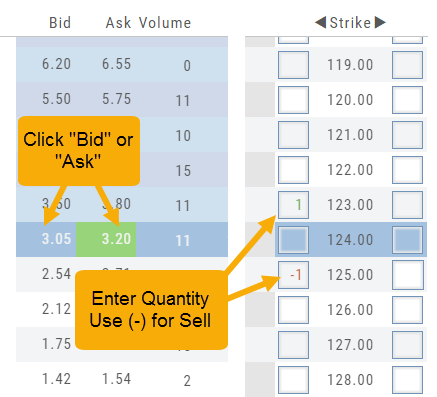
You can enter a position to analyze by clicking on ‘Ask’ for buying or ‘Bid’ for selling. You can also directly enter the quantity in the entry box. (Note: make sure to indicate a selling position with a minus (-) sign).
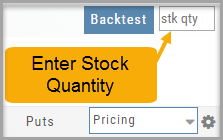
For positions that include the underlying stock, such as Covered Calls, Protective Puts & Collars, enter the stock quantity in the upper right corner of the chain window.
You can change the click quantity amount by changing the default-click parameter (found at the top of the Option Table) for 1x, 5x or 10x.
Trading from Options Page & Strategy Templates
Structure and analyze any options position. When ready, click “Trade” to create and submit an Order Ticket.
Comparing trades with Snap? 
Simply choose the structure you want then select “Trade” to send it to the Order Ticket.
Trading multi-leg positions is easier than ever!
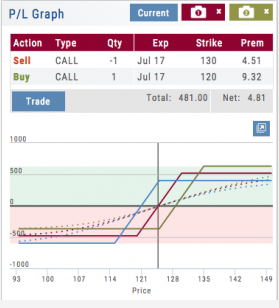
Trade from the Options Tab
Trading from the Options Table is easy!
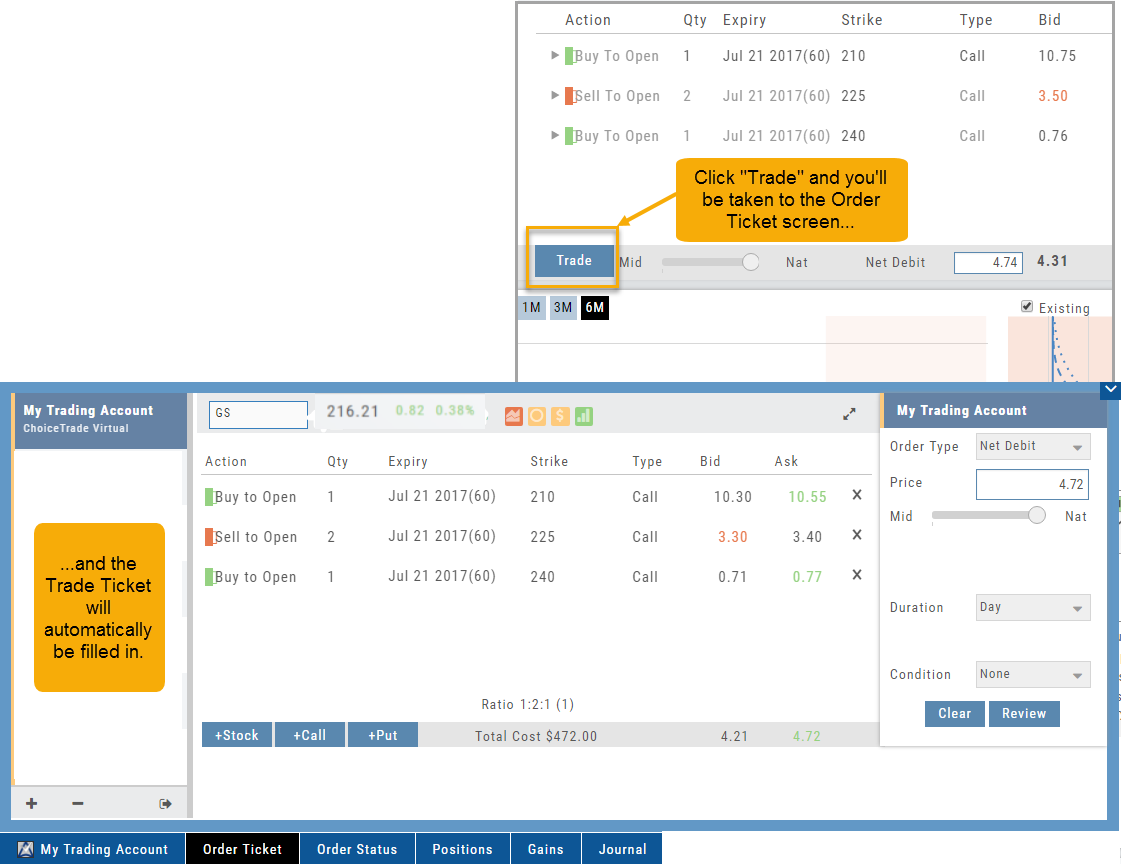
When a position is set up on the Option Chain or from one of the Strategy Templates, simply click the “Trade” button.
The Position will be sent to the Order Ticket where you can further edit:
- Adjust Price between “Mid” and “Nat”
- Change Duration: Day or Good Til Cancelled
- Change Order Type: Limit, Market, etc.
- Click “Review” to confirm Order Details and Account are correct
- Then “Submit” to send to brokerage.
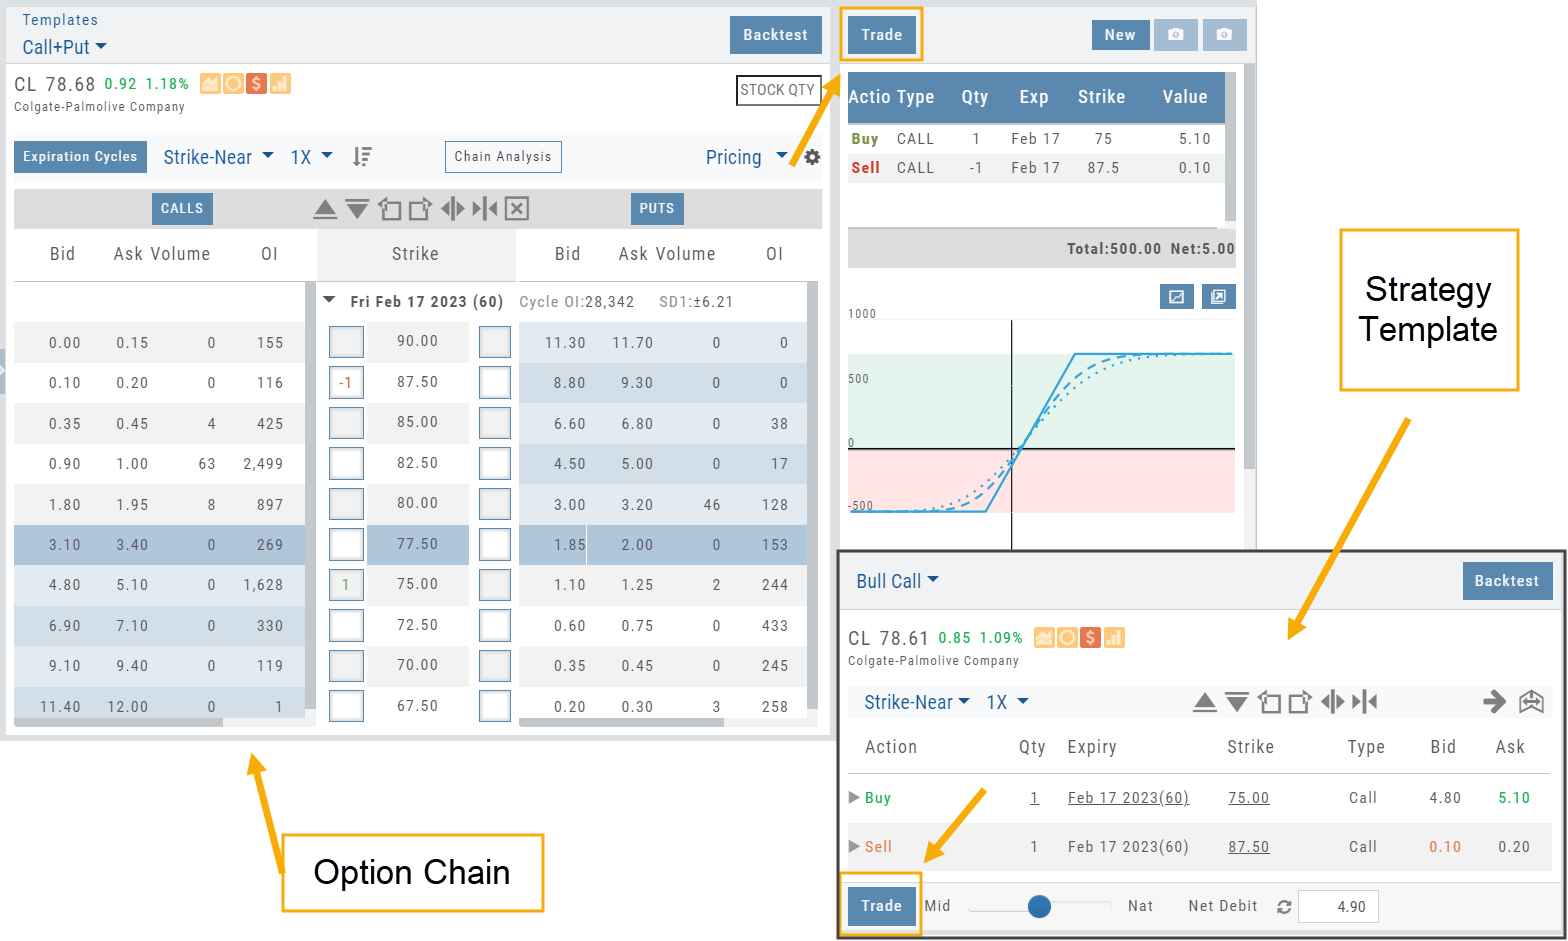
Trading from the Option Template
From Template to trade is easy.
Simply click the “Trade” button on the Option Template and the Order Ticket will be filled in for you. This not only saves time, but eliminates order entry errors.
You can connect directly to select brokerage firms right from the platform and execute the trade.
From Strategize to Analyze to Trade
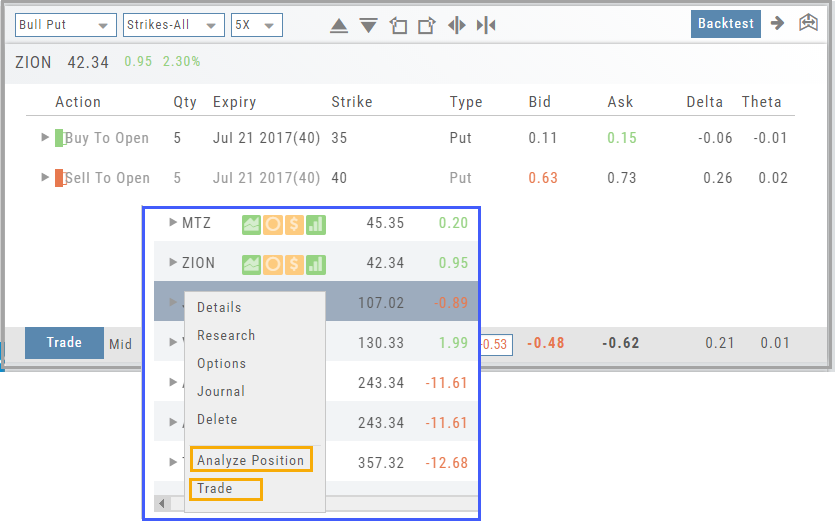
Any strategy-specific options trade will have ‘Analyze’ and ‘Trade’ in the Action Icon.
Click ‘Analyze’ to see the trade in the options chain. From there, you can edit or click ‘Trade’ to have the trade sent to the Order Ticket of your brokerage account.
Give it a try!

Analyzing a position
New text — pending review
Profit/loss graphs, volatility, advanced analytics, price slices, and the bid/ask spread percentage — the tools that show what a position is really doing.
Profit/Loss Graphs
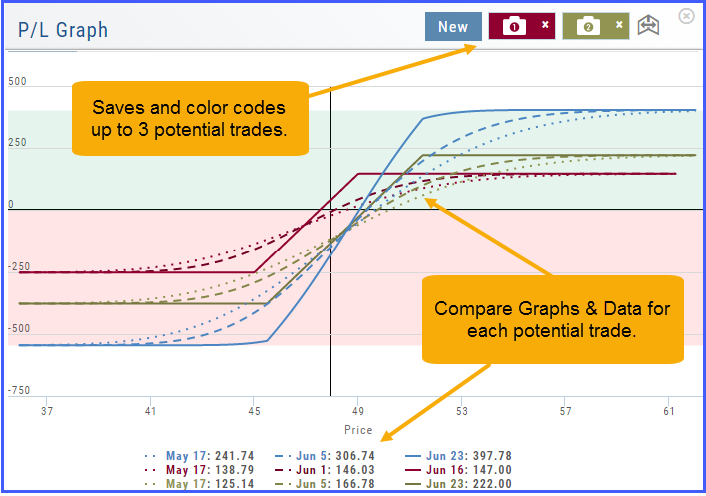
Any position entered in the Options Chain (Calls+Puts, Calls or Puts) will automatically display a profit/loss risk graph. The P/L Graph shows the Trade Profile Performance from the current day.
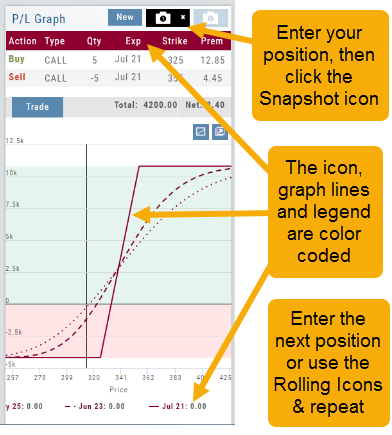
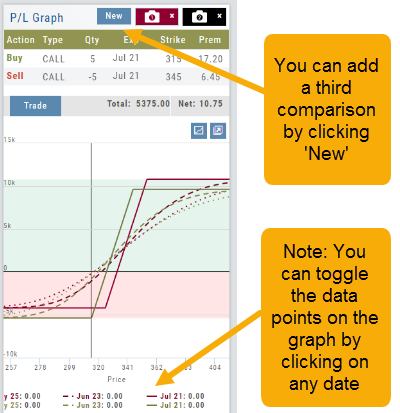
You can compare up to three (3) positions on one graph by utilizing the Camera Icons. Once you complete one trade scenario, click the first camera then click ‘New’. Structure your second trade scenario, click on the second camera. To add a third scenario, click new to structure an additional trade. The graphs will overlay.
Advanced Analytics
Some strategies are more responsive to time decay and/or volatility than others. This platform has tools to help analyze these components.
- Construct the position in the Option Chain table
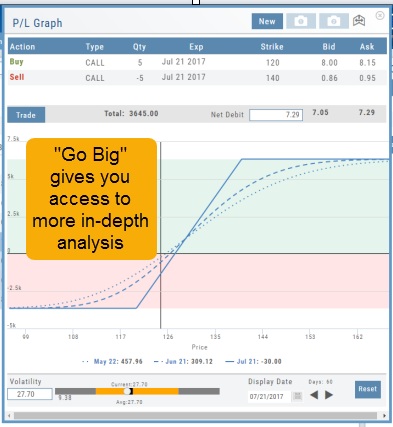
- Select the ‘Go Big’ icon on the P&L Graph
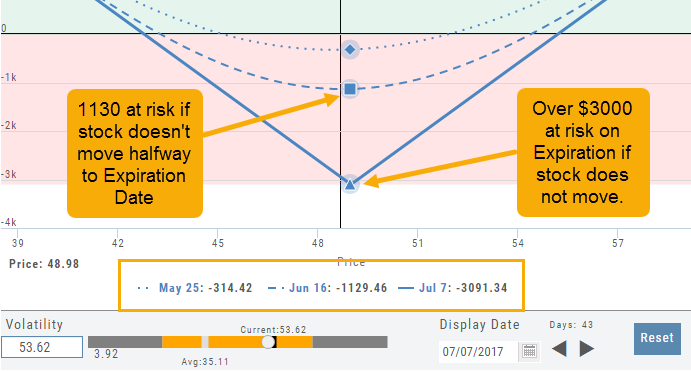
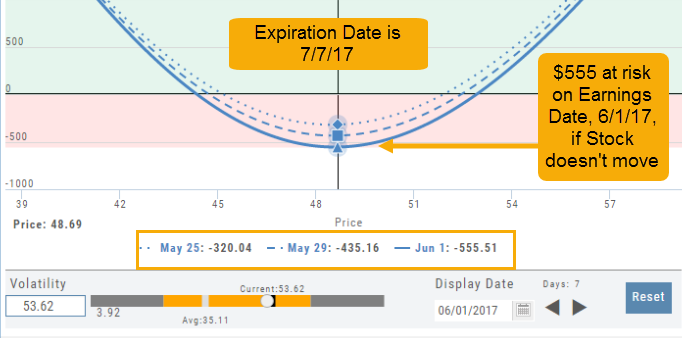
- The Graph shows 3 data points: Current Day, Halfway point to Expiration Day & Expiration Day. The corresponding legend, immediately below the graph, follows the cursor slider along the graph.
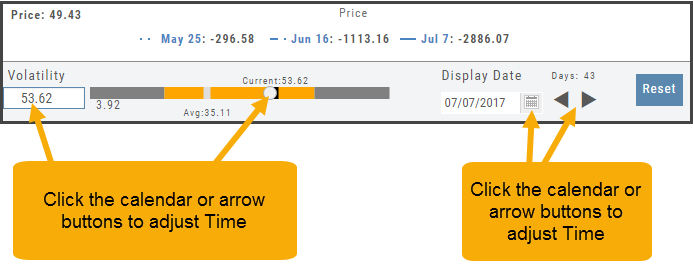
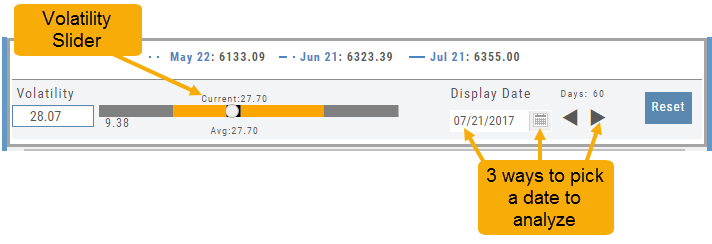
- The bottom of the screen contains a Calendar (Time) & Volatility Scale. Both can be manipulated to analyze the position.
Time: You can select a date to analyze as well as user stepper buttons to move day by day backward or forward.
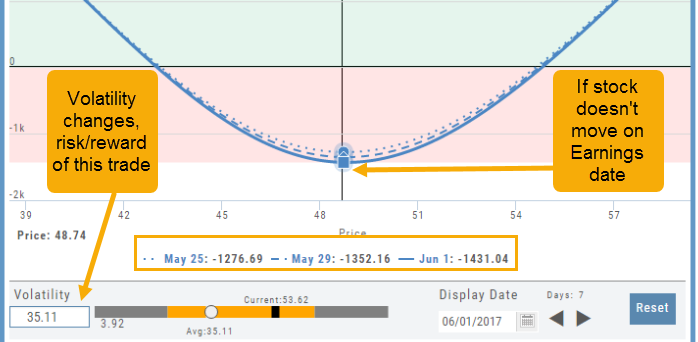
Volatility: Use the volatility slider or enter a value in the entry box to see the impact of changes in volatility. The slider bar also displays the current (circle), average (gray), and 1 year high / low of implied volatility (orange portion of the slider) for easy reference.
Historic & Implied Volatility
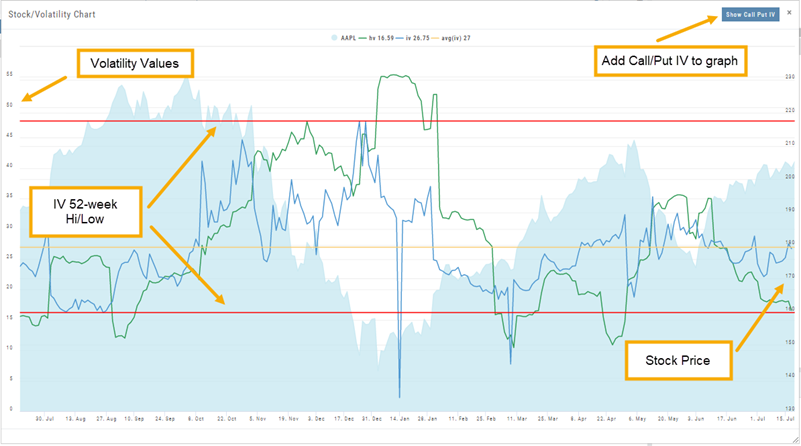
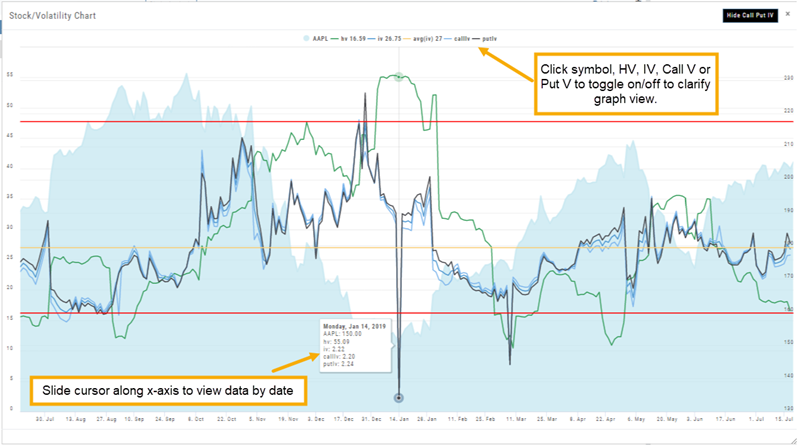
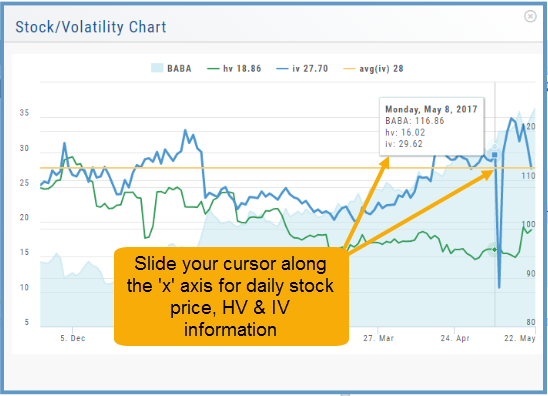
This chart displays Historic (HV) and Implied (IV) Volatility with the ability to overlay Call/Put IV
Historic Volatility (green line) is based on how the stock actually moved.
Implied Volatility (blue line) is based on how the options are priced.
When expanded, the stock chart, 12-Month Mean (Average) IV and one-year IV High/Low (red line) are also shown. This is very helpful in understanding if option premiums are comparable to historic values.
High HV indicates recent strong movement.
High IV indicates higher premium and, in many cases, anticipated movement.
Note: You can remove the Stock Chart, HV, IV or Call/Put IV simply by clicking on the corresponding indicator above the chart/graph.
Options Chain Analysis
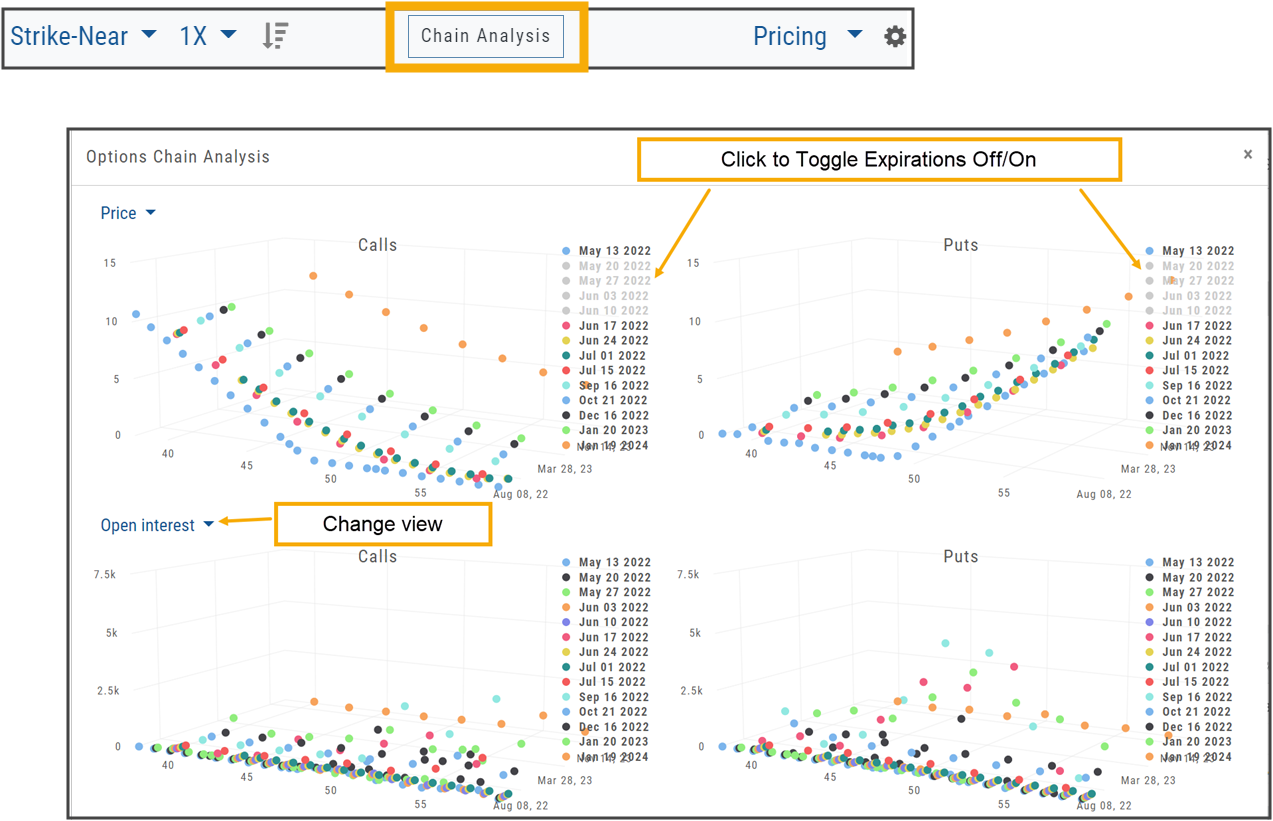
The Option Chain pages offers a 3-D analysis comparing expiration dates by selected criteria.
Click on “Chain Analysis” to display the graph.
Use the drop-down boxes to view the tables by Implied Volatility, Volume, Open Interest, Price, Extrinsic Value, Delta or Intrinsic Value.
Toggle the view by using the clickable legend to select the Expiration Dates to view.
Go Big – Graphs & Charts
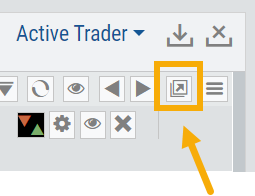
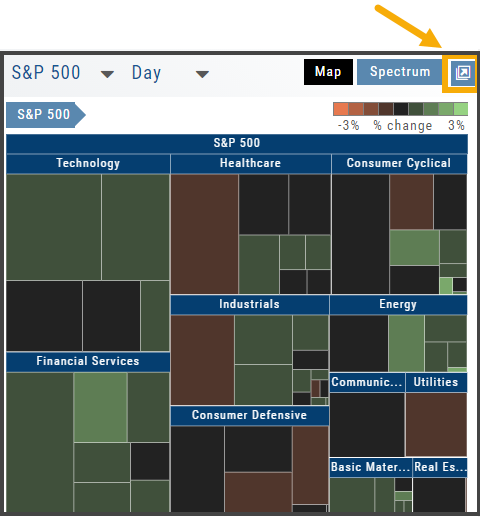
Anywhere you see the ‘Go Big’ icon  , you can expand the graphic and access additional information.
The Chart Tab under Research has such a button in the icon toolbar as shown:
The Heat Map on the Market Tab will allow you to filter criteria such as stock price, volume, market cap, etc.
In the Options Tab, you can do this with the P/L Graph and the Volatility Chart. The icon is located at or near the upper right of the graph or chart.
Expanding the Stock/Volatility Chart allows you to view past Historic Volatility, Intrinsic Volatility and stock price on a day-to-day basis.
For deeper Trade Analysis, use the Volatility Slider tool and the Date Picker, located at the bottom of the P&L Graph:
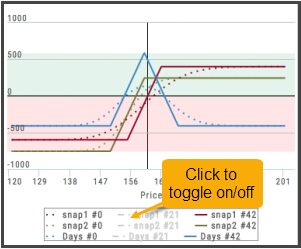
Clickable Legends
When comparing trades using the Snapshot feature, the P/L Graph can get a little crowded. You can clear some of the lines by simply clicking on the legend to toggle visibility.
Clickable legends are also available in other graphs and charts within the platform.
Multiple Position Analysis
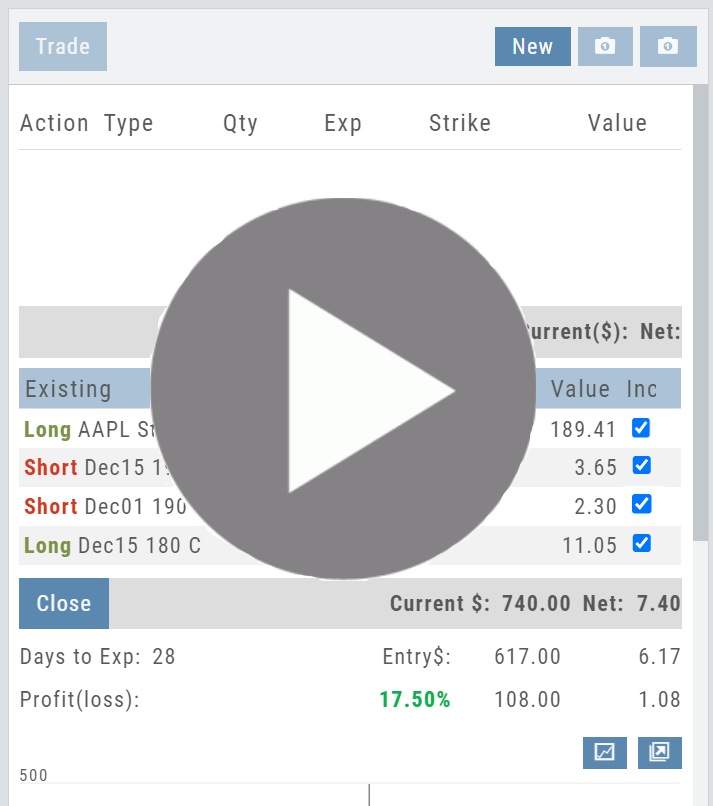
We often have more than one position on a particular Stock/ETF, so how can each position, or leg be evaluated?
Click the Graphic Below for video on the Option Tab P/L Feature to see how to evaluate individual legs or positions on a Stock/ETF
Position Indication on the Chain
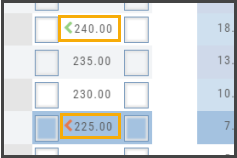
When evaluating an existing position on the options chain, the positions held are indicated with arrows on the chain. The arrows point to the quantity entry box of the held position.
Green arrows  indicate Long or Buy positions.
Red arrows  indicate Short or Sell positions.
Trade Management
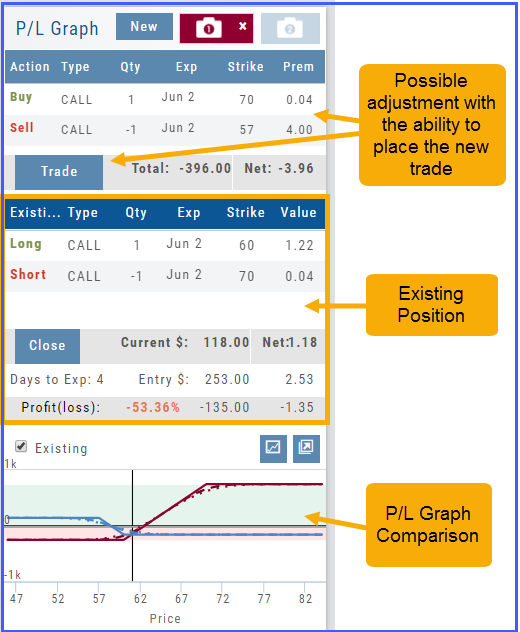
This platform makes it easy to manage and adjust trades when needed. The Snapshot feature and the P/L graph enables you to visually assess adjustments.
Once the existing trade is showing on the options page, take a ‘snapshot’. Enter the adjustment, then take another ‘snapshot’.
To submit the adjustment to the Order Ticket of your brokerage account, click “Trade”. The smart ticket system will even handle the trade adjustment automatically by entering the appropriate buy/sell, open/close combination.

Adjusting a position
New text — pending review
Rolling a position forward and comparing candidate adjustments side by side.
Rolling Positions
It’s easier & faster to evaluate your Trade
Once you have entered a position, you can easily make adjustments for further evaluation using the group of Rolling Icons in the upper-center part of the Option Table.
These icons will allow you to move the whole position:
Up or Down Strike Prices
Extend or Shorten Time
Widen or Narrow the Spread
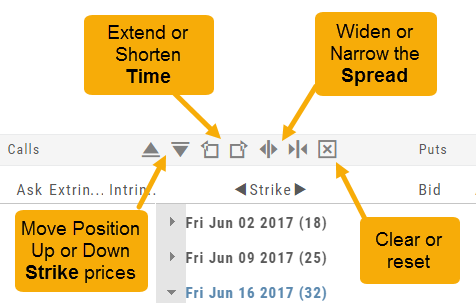
The [X] acts as a clear function. Clicking once will clear the current positions in the chain. Clicking a second time will act as “all clear”. This will clear any snapshot trades and fully reset the option chain.
Snapshot: Comparing Positions
The Snapshot feature gives you the ability to compare up to three scenarios in one view without having to change screens or erase previous setups. You can even submit a trade from this part of the platform!
- From the Calls+Puts chain (as well as “Calls” or “Puts”) enter the initial trade position.
- Next click one of the camera icons:

- Repeat the first step using the Rolling Icons to adjust the initial position to a new scenario:

- Click the 2nd camera icon & repeat the above steps for the last trade comparison.
Note: The position lines are color coded to match the Snapshot (or New) icon.
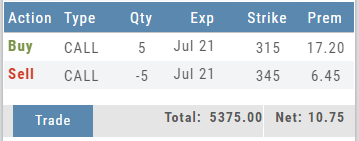
Once you decide on the optimal position, click ‘Trade’ from the P&L Graph and you’ll be taken to the Order Ticket of your brokerage account with the option information auto-filled.
Backtesting
New text — pending review
Test a strategy against history before you trade it: start and analyze dates, backtesting scan results, SNAP, and what time does to an option position.
How to use Backtesting
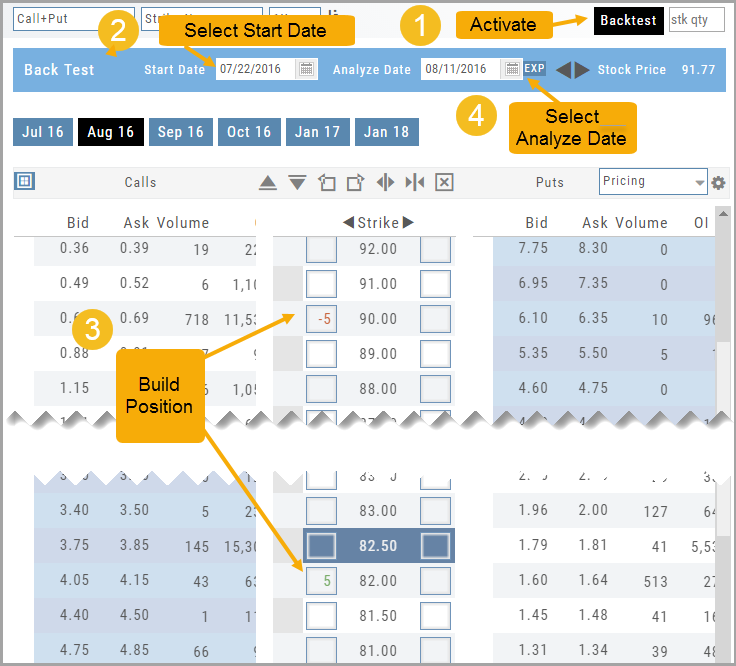
Activate by clicking “Backtest” in the upper right of the Option Table screen.
- Select a start date.
- Enter position in the options chain.
- Select analyze date.
Your position’s P/L Performance and Risk Chart are dynamically updated.
Start Date
Click the Calendar and select any past Market date. You can quickly choose a previous date by clicking on the “month” then arrow back by year. The closing price for that stock will be displayed.
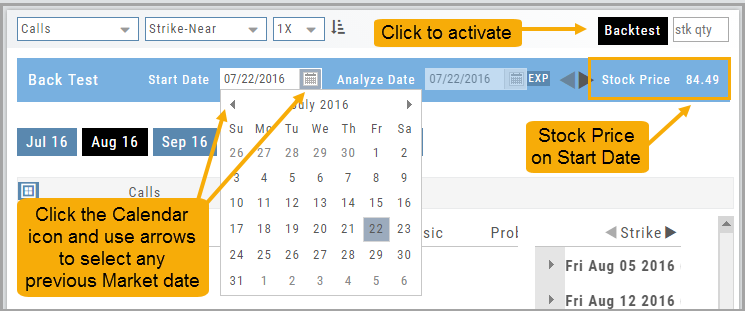
You are now ready to create the position to analyze – either by clicking “Bid” or “Ask” or by entering the quantity in the appropriate box(es).
Note: In order to ‘backtest’, the platform needs to establish an orientation point in time. If you change the ‘start date’, the option expiration cycle may change to re-establish the reference point in which to pull information from.
Analyze Date
After the position is entered, click on the “Analyze Date” calendar to select the date.

You can click “EXP” to further analyze the trade on the option’s expiration date or use the arrows to move the original analyze date forward or back.
Your Position Analysis will display with estimated gain/loss calculations and the P/L Graph.
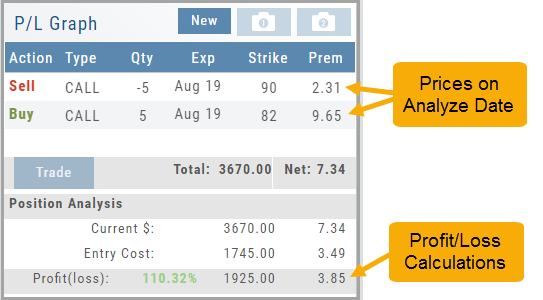
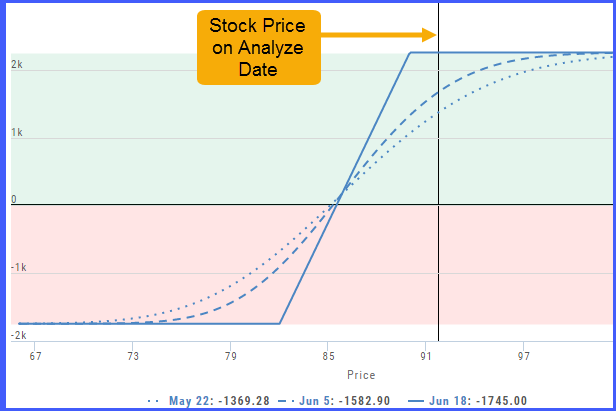
The P/L Graph will also display the stock price on the analyze date via the vertical line.
Note: The prices in the options chain will show the start date prices. The prices in the Analysis Panel will reflect the Analyze Date prices.
Once you have selected your date for analysis, you can edit the position, or try a different position, and the analysis will dynamically update.
Backtesting Trade Finder scans
You can ‘look back’ (Backtest) Trade Finder Scans by following these steps:
- Select your Scan (example: Bull Put – Stock above 200 SMA).
- Click on the Calendar at the top of the screen to select a previous date (clicking on the month allows you to select a previous month, or arrow back to a previous year).
- Select stock symbol, click on action icon to ‘Analyze Position’.
- The trade template will populate with the specific scan, note the date on the screen is the ‘start date’
- Select the Analyze Date, or click ‘EXP’ to analyze the position on Expiration Day.
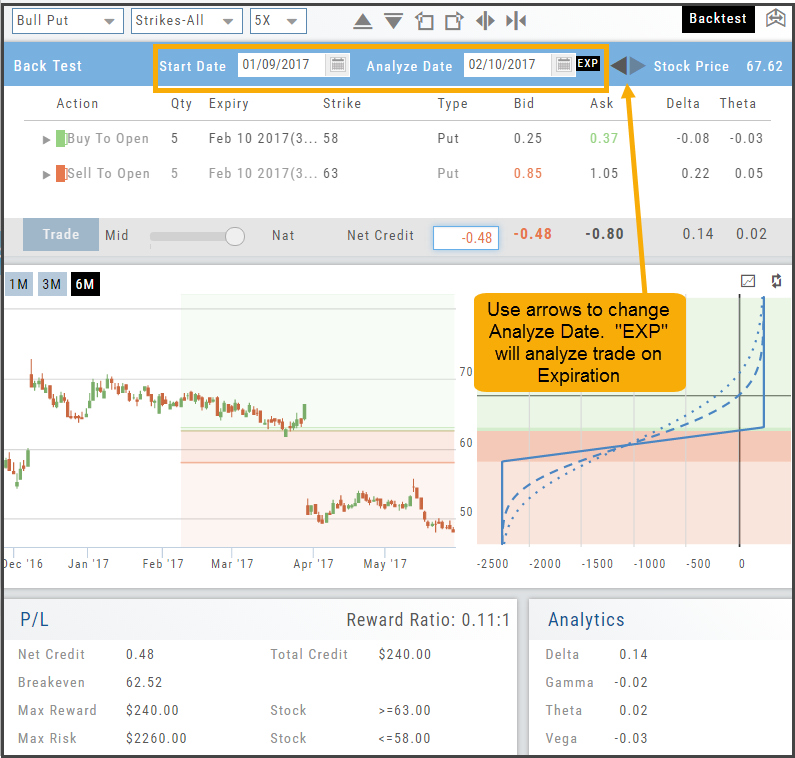
By clicking on the ‘Go Big’ icon of the Trade Price chart shows the Entry and Exit Dates (cross hairs) as well as the behavior of the trade compared to the stock.
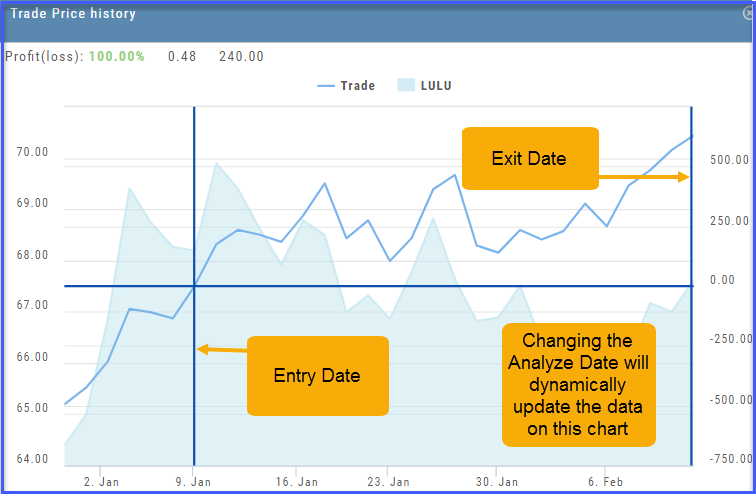
Note: Changing the analyze date dynamically changes the data of the P/L chart.
Use SNAP to Backtest Positions
The Snapshot feature is also available with Backtesting.
- Click ‘Backtest’ on the Option Table
- Set up position
- Click one of the camera icons:
- Repeat the first step using the Rolling Icons to adjust the initial position to a new scenario:
- Click the 2nd camera icon & repeat the above steps for the last comparison.
- Select the ‘Analyze Date’ using the Date Picker (Calendar) or “EXP” to analyze the position on Expiration Date.

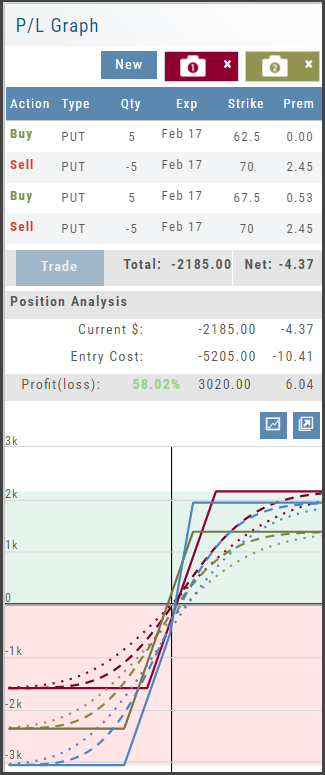
The Power of Time
The Backtesting feature allows for an interactive way to understand the characteristic of the strategy.

You can also see its performance over real data without having to wait for the market.
Give it a try!