When you need candidates, this is the machinery: ready-made scans, a build-your-own screener, the market calendars, and the AI tools that sit on top of both.
You can read straight through, or use the contents list to jump to what you need. Every section below is also a standalone article — the “Open as article” link under each one takes you to it on its own page, if you want to bookmark or share just that piece.
Scans
The ready-made searches: what the categories mean, reading a result tile, filtering, saving favorites, past results, and the premium intraday updates.
Overview of Scans
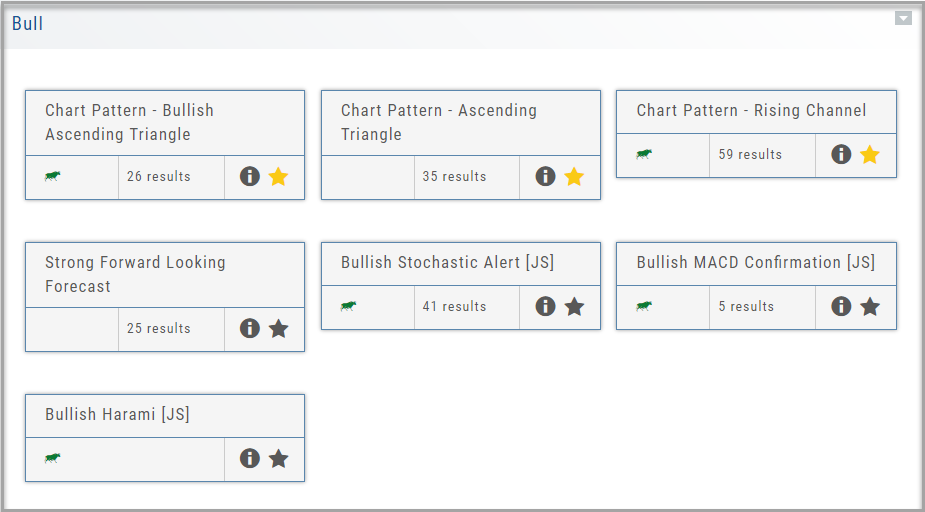
Want some ideas to take advantage of market conditions? This is the place to find Stock and Option opportunities based on bullish, bearish and stagnant outlook.
Choose from dozens of scans based on events or components of “The Score”: Fundamentals, Valuation, Technical & Inner Circle.
Ideas and Features offer even more opportunities.
The [i] icon provides a short explanation of the strategy.
Best of all, you are able to keep your favorites all in one place by ‘starring’ it for future use.
Scans – Find Opportunities – Overview
Stagnant? Uncertain? Bearish or Bullish? Short or long term? No problem!
This “Find” category is where to find opportunities based on current Market activity and outlook, or select opportunities based on events, such as Earnings or Dividend announcements.
Whether looking for opportunities based on The Score, Events, Chart Patterns, Bullish, Bearish, Stagnant or Unknown outlook, a scan will help you find potential trade opportunities.
You can drill-down for scans by Category, Sub-Categories, then Group.
Example: Strategy>Time Spreads>Call Calendar Spreads. You can use the drop-down box, above the Category boxes to search for the scan you want or type in the box a generality about the scan. Examples: “Earning”, “Bull”, “Bearish”. “Score”, “Red”, “Green” will yield scans with that particular name in the scan
The Top 4 Categories
The names may be different, but the scans remain the same!

Feature – Your favorite and our highlighted scans, including scans related to The Score.
Ideas – Scans for general ideas including Dividends, Money Flow, Volatility, Earnings and more.
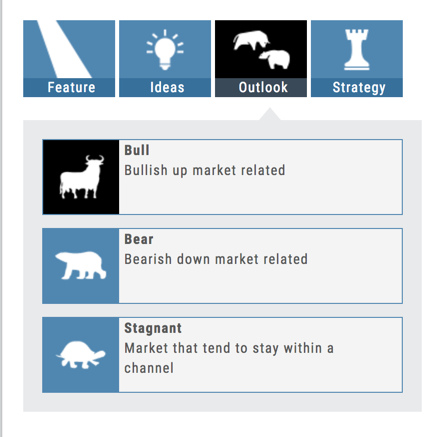
Outlook – For Bearish, Bullish and Stagnant outlook conditions.
Strategy – Over 20 strategy-specific scans including Bull Put, Bear Call, Iron Condor and more.
Scan – Smart search
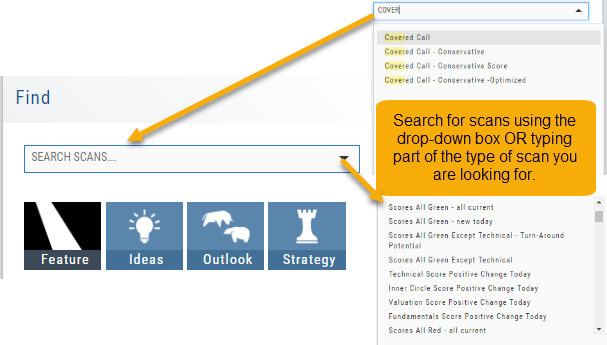
The search box is found at the top of Find. It performs ‘smart searches’ by pulling all scans related to what is typed in. If you don’t know the name of the specific scan, but know it is related to Earning announcements, type “earning” and a list will populate showing scans that are about Earning. Typing “Bull” or “Bear” will bring up scans with “Bull or Bullish” or “Bear or Bearish” in their names, respectively.
Of course, you can also elect to search by clicking the arrow for a complete list of available scans in a drop-down search.
The Tile
The Scan Name and number of results are displayed on each Tile. Click on the  on the upper right corner of the screen to display Scan Criteria.
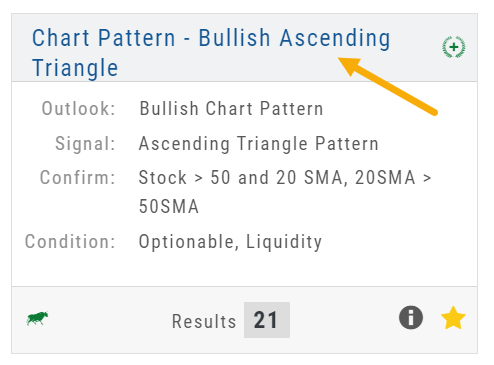
Click on the name of the Scan Header to view results.
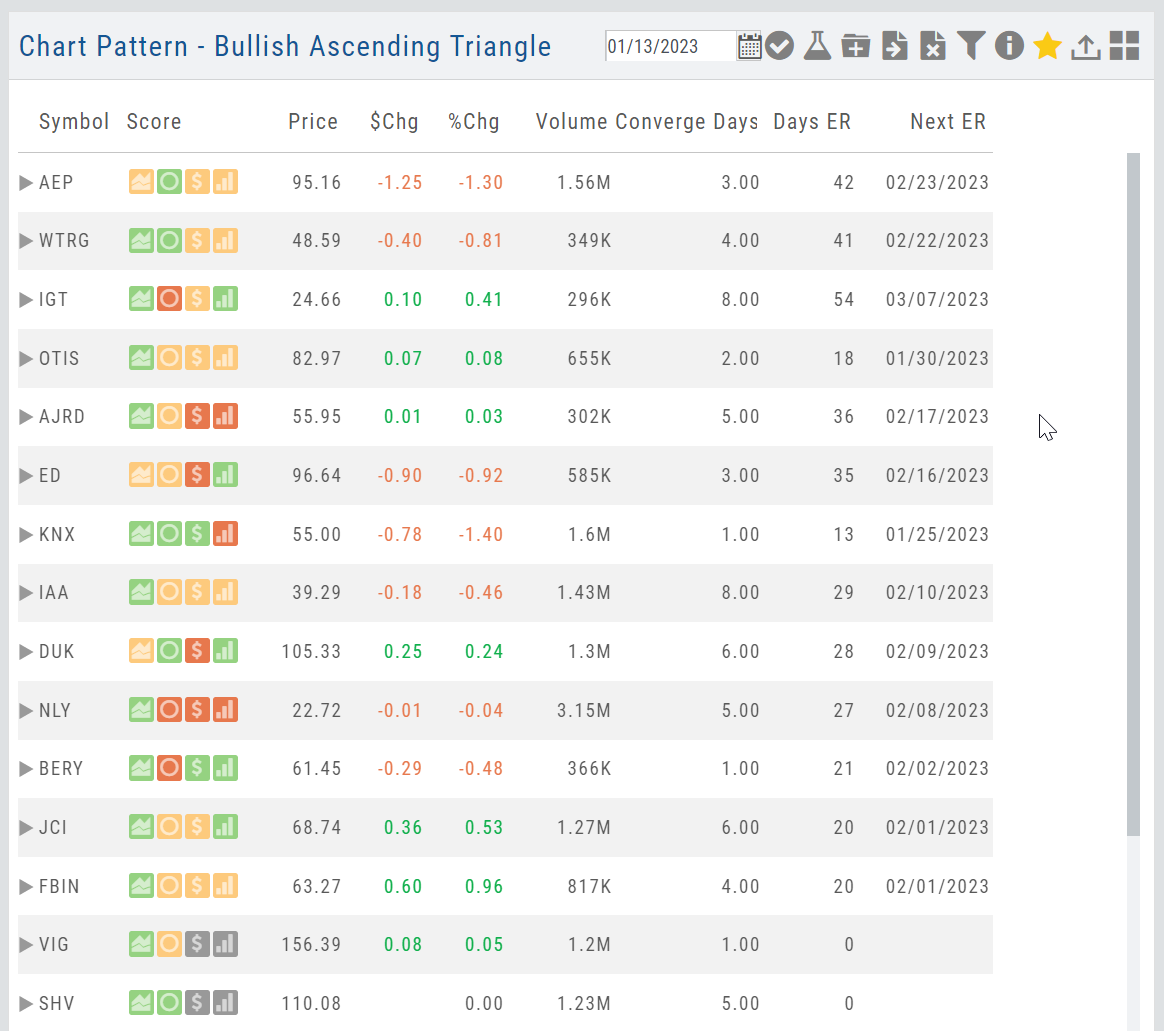
Use the toolbar icons on the results page to Research, send to a Watchlist, Filter, etc.
Dynamic Scan Information
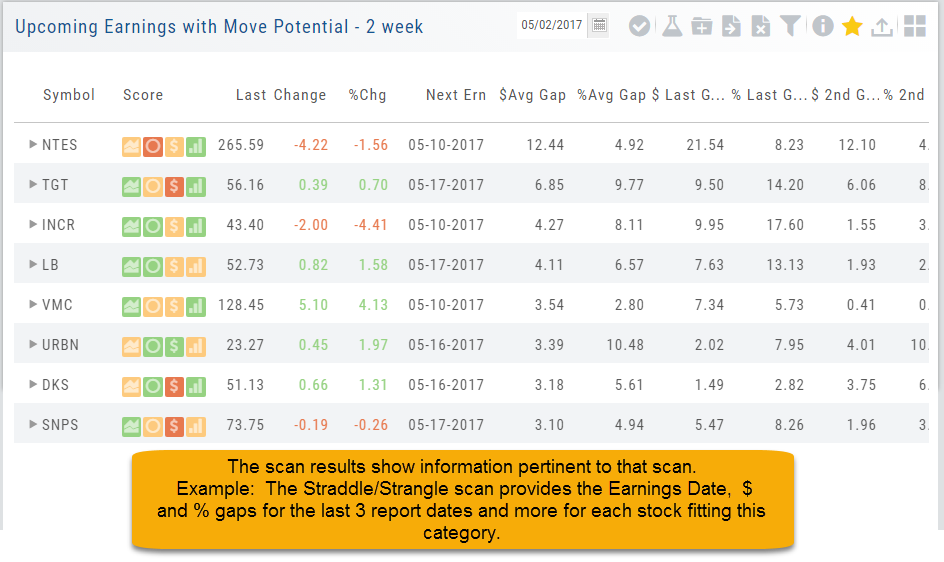
The scan results provide relevant information for that scan. For example: Dividends will show Yield, Covered Calls will show the options position, potential return, net cost and more.
This allows you to quickly pick stock candidates and bypass others for high-probability trades. For example, you may wish to eliminate stocks priced too high or low, those with low volume, etc. Use the Navigational tools (Action Icon, The Score Icon, Send to Watchlist or Research for example) to dive deeper in selecting the best stock.
Filter Scan Icon
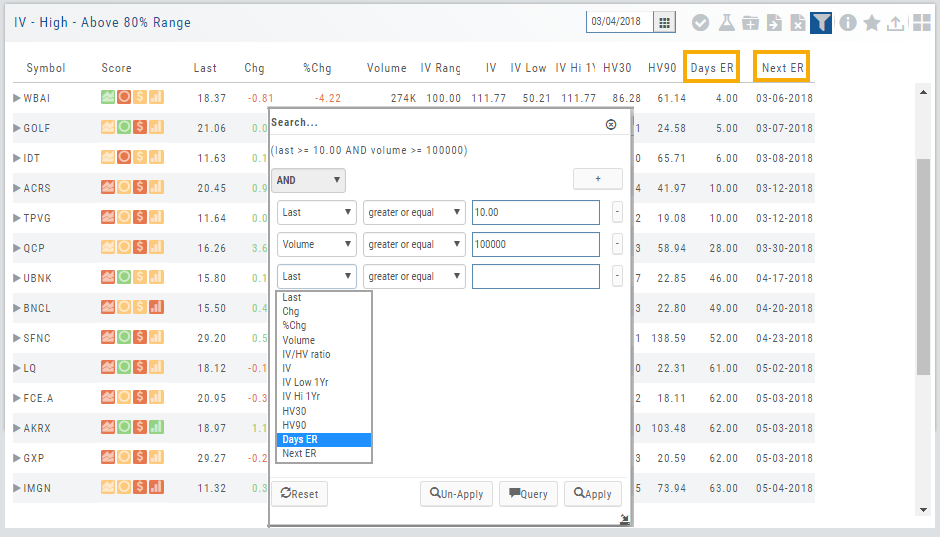
The Filter icon  – located in the upper left area of the scan page – allows you to narrow candidates of an initial scan by applying additional parameters.
You can adjust the criteria at any time to further narrow or increase the number of results by eliminating, adding or adjusting entries.
This Smart Search feature filters data unique to the scan. Ex: Covered Calls Filtering offers Net Entry Cost, $ Return with no Movement, $ Return if Called out, etc.
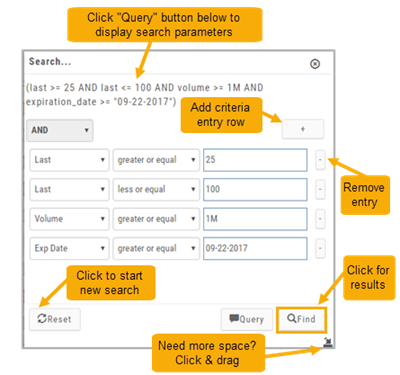
Use drop-down box to select parameters and enter criteria in boxes.
Add rows if needed by clicking on ‘+’
If you need more space, click and drag the arrow in the bottom, right corner.
Click “Find”.
Click ‘Reset’ to start over. The “Query” button displays the criteria at the top of the Filter page. Click again to remove.
Give it a try!
Past Scan Results
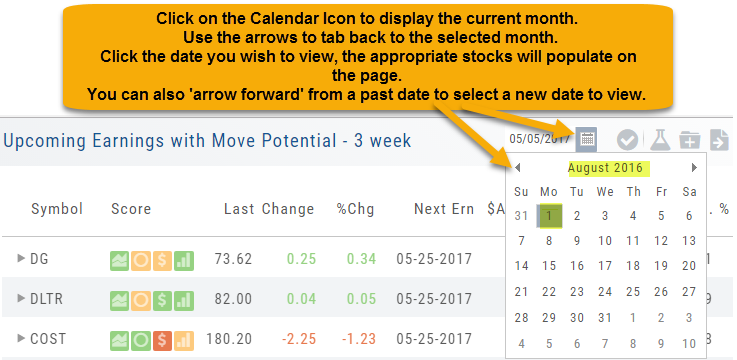
When viewing scan results, you can select a past date by clicking on the Calendar Icon, then the back arrow until you get to the month you want to search from. Click on the date you wish to view & the appropriate stocks will populate the screen.
The date you are searching will be displayed in the header.
Note: Past Scans availability dates vary. When a new scan is added, the history is available from the day it was added to the platform going forward.
Save your Favorite Scans
Create your Customized Scan List
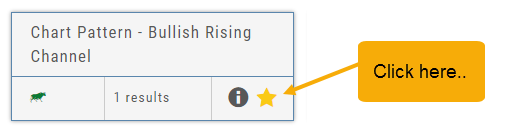
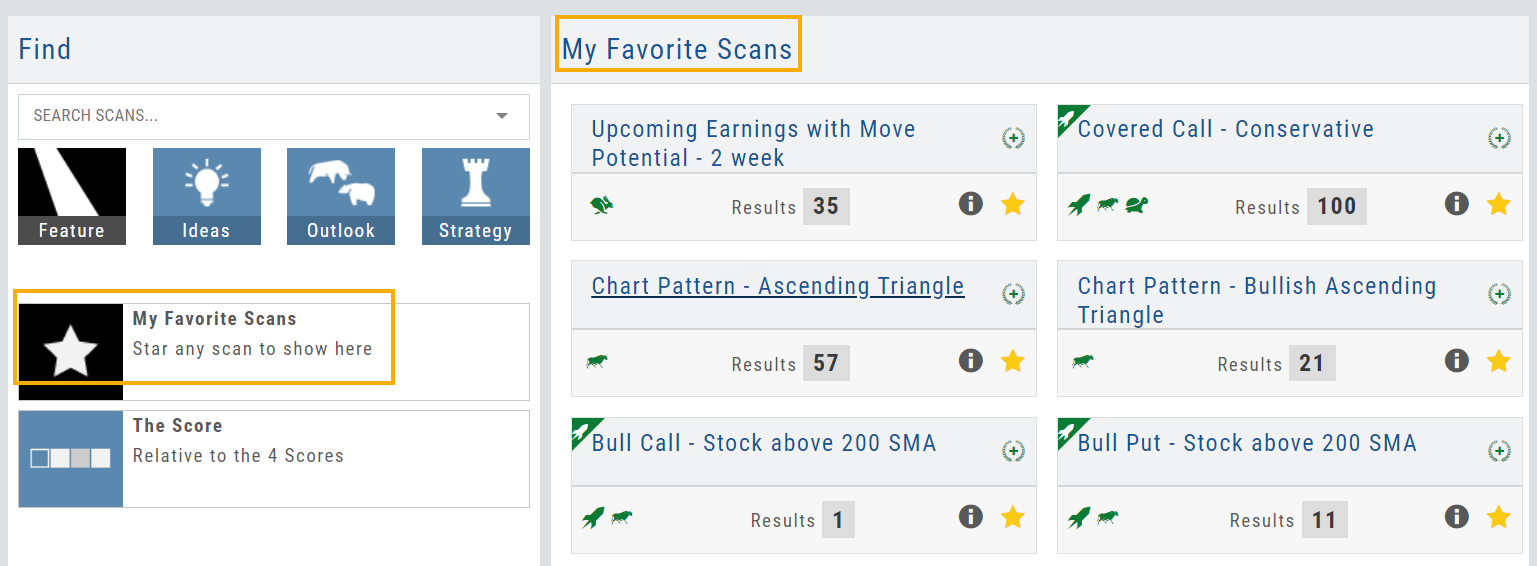
Star any scan to have it show in Feature > My Favorite Scans.
There are two ways to do this:
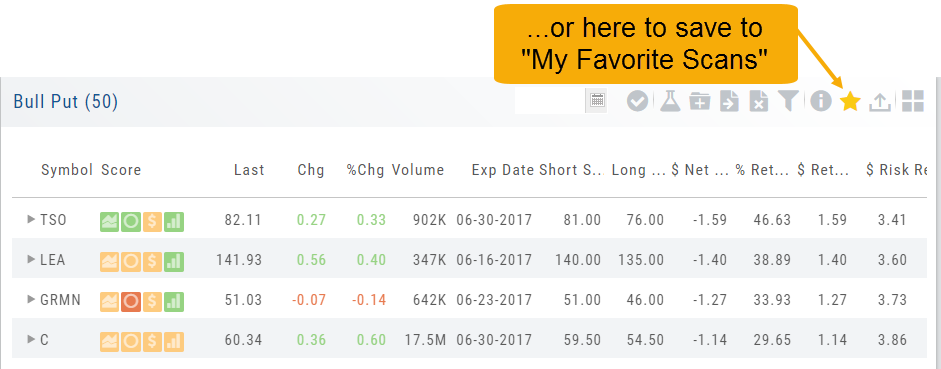
Simply click the star  on the Tile View of the scans or on the header in the results view of any scan.
Favorites will be easily accessed from the Scan main page
Intraday Trade Finder Scan Updates (Premium Desktop Feature)
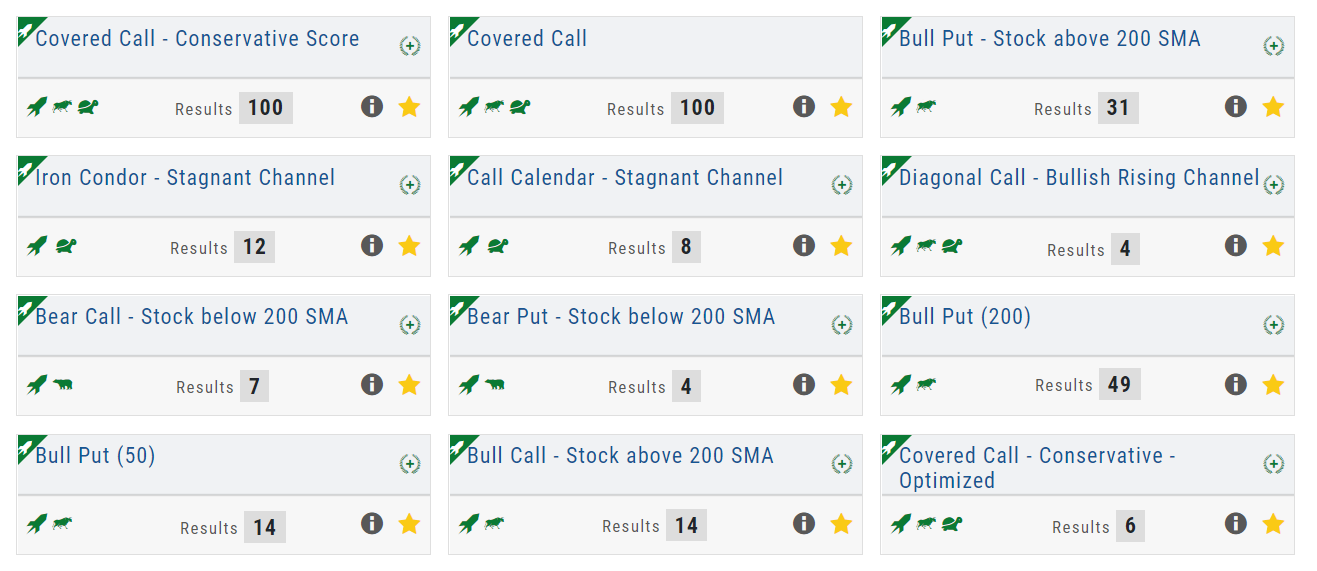
Trade Finder Scans are updated every 30 minutes during Market Hours on the Premium Platform. That’s 12 more times than the Standard Platform version, which updates once after the Market opens.
Trade Finder Scans are easily identified with a Rocket Icon in the upper left corner of the Scan box.
The Dashboard Scan Tab
Get the current ‘story’ on a stock.
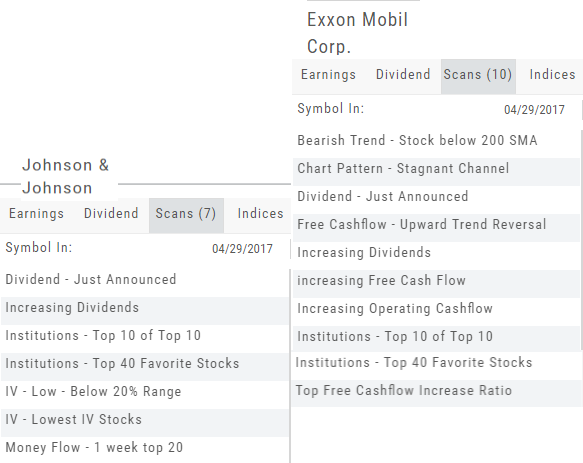
The Scan Tab is particularly interesting. In addition to providing a list of scans the stock is currently included in, it can give you a “story” about the stock. Based on the scans that the stock is showing up in, you can get an overview of outlook on the stock.
For example: JNJ shows solid longer term positive outlook.
XOM Shows stagnant with improving longer term outlook
The Screener
Build a search from your own criteria, save it, and refine it as your strategy sharpens.
Screener (Premium Desktop Feature)
Screener
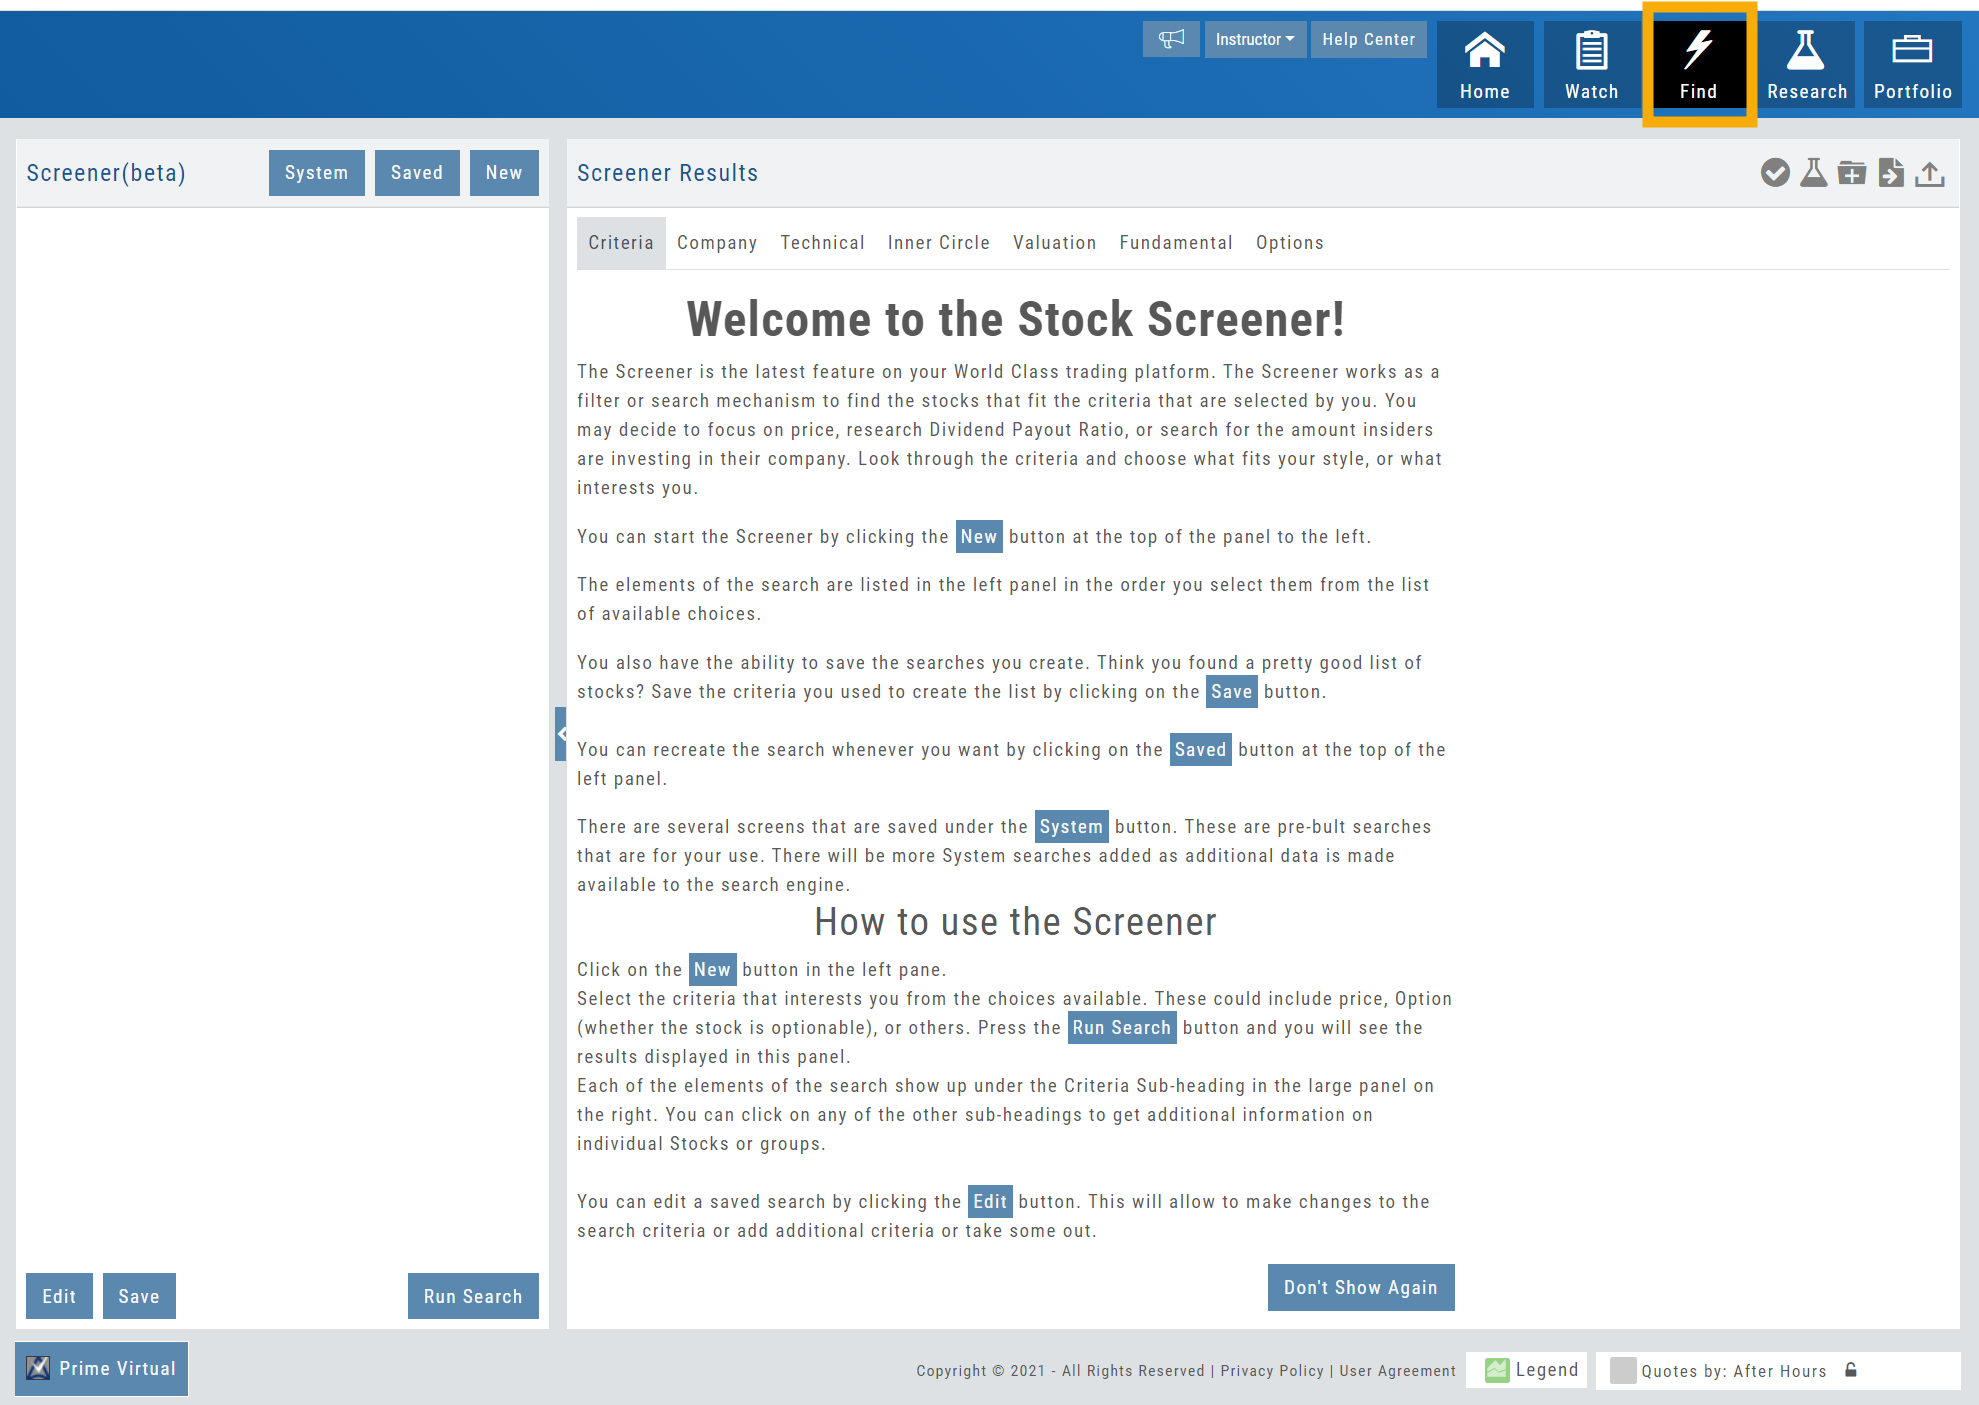
Located under the Find Tab, the Advanced Screener is designed to allow the user to customize their own trade candidate searches. Several hundred data points are available to select from, build your Screen, Save for future use and Edit as needed.
Screener is flexible – allowing you to create save as many Screen searches as you wish, edit as needed, even download results.
The Screener feature differs from Scans, where candidates meet pre-defined criteria that can be further refined through filters, but cannot be changed or deleted.
Screens are user-defined, and 100% customized to the user’s specifications. They can be edited, saved, and deleted.
Left Control Panel

New – Create a new screener
Saved – Previously created and saved screens. Saved screens can be edited for single use, saved as a new screen, or to overwrite the previously saved screen
System – Templates available for use as starting points for new screeners. While the System screens themselves cannot be modified, they can be used as a foundation for newly created screens that can be modified for personal use and saved.
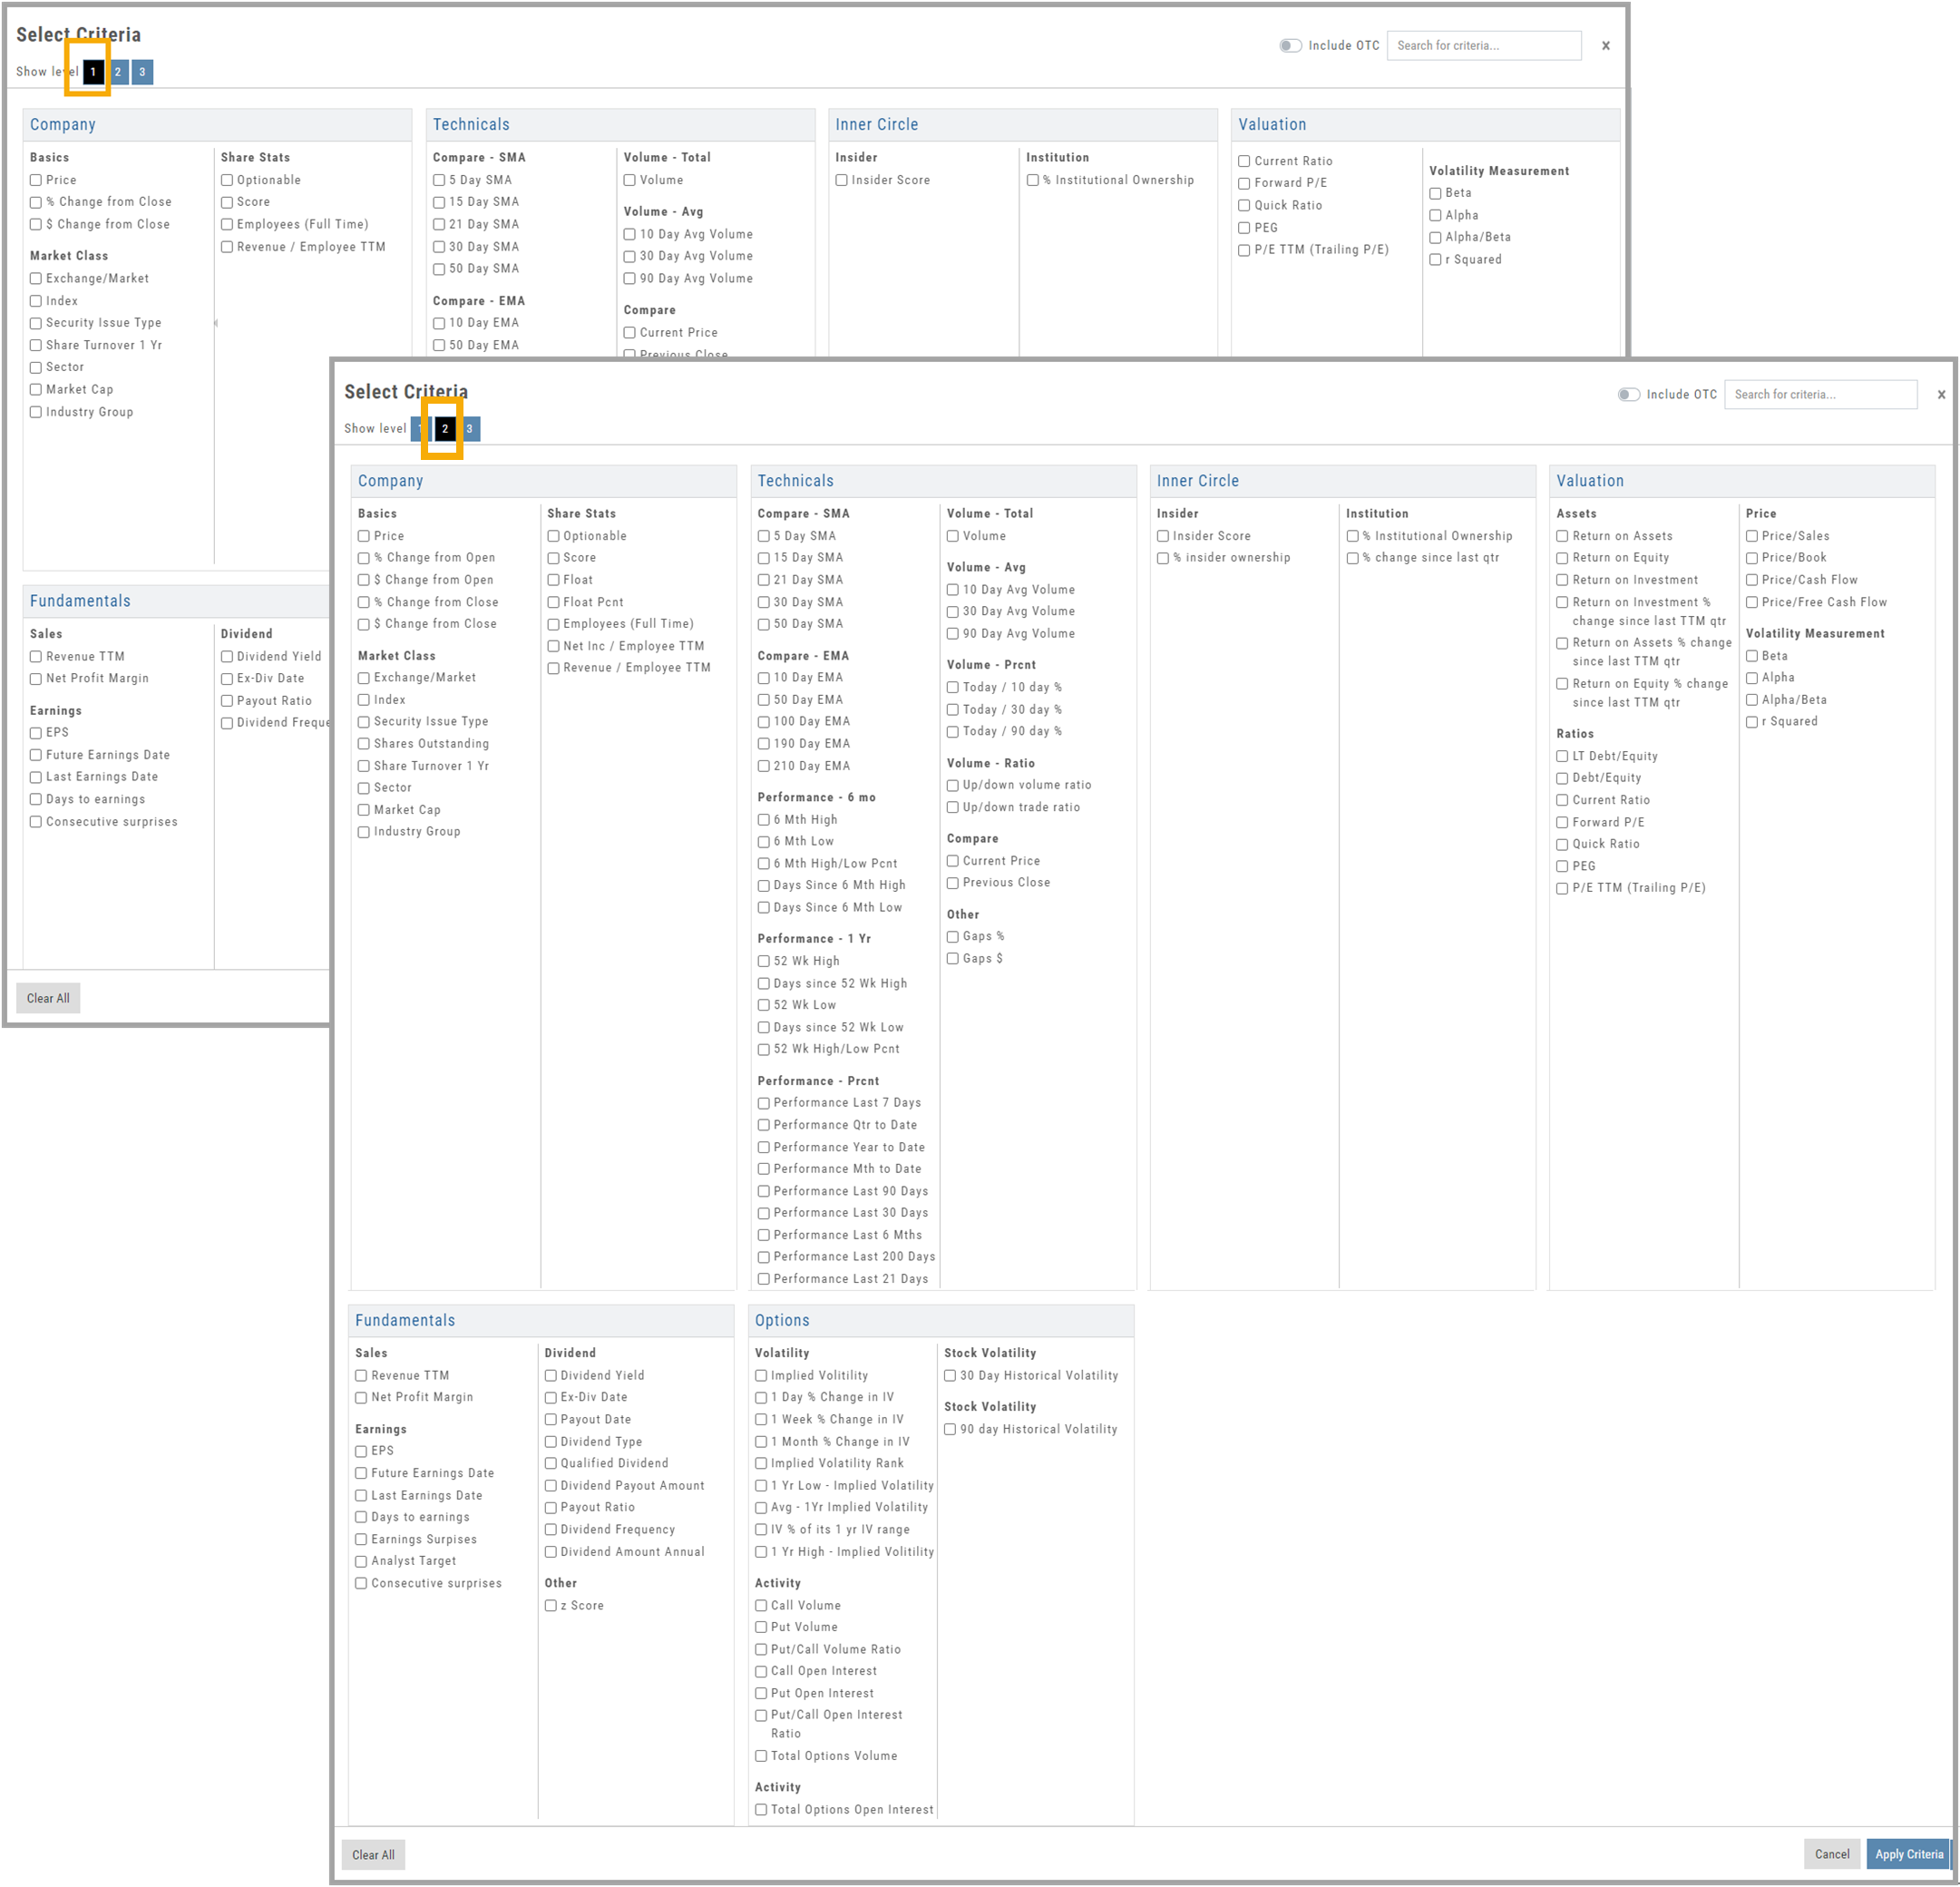
Select your criteria
There are 3 Levels of Data.
Level 1 offers Basic Information to select from. Level 2 expands upon what Level 1 offers. Level 3 offers all available, in-depth selections.
After choosing your criteria, you’ll be able to set the parameters for each criteria selection on the next screen.
Click “Run Search”
Note: The order the criteria are selected, will be the order the selections are displayed on the next screen.
The Results
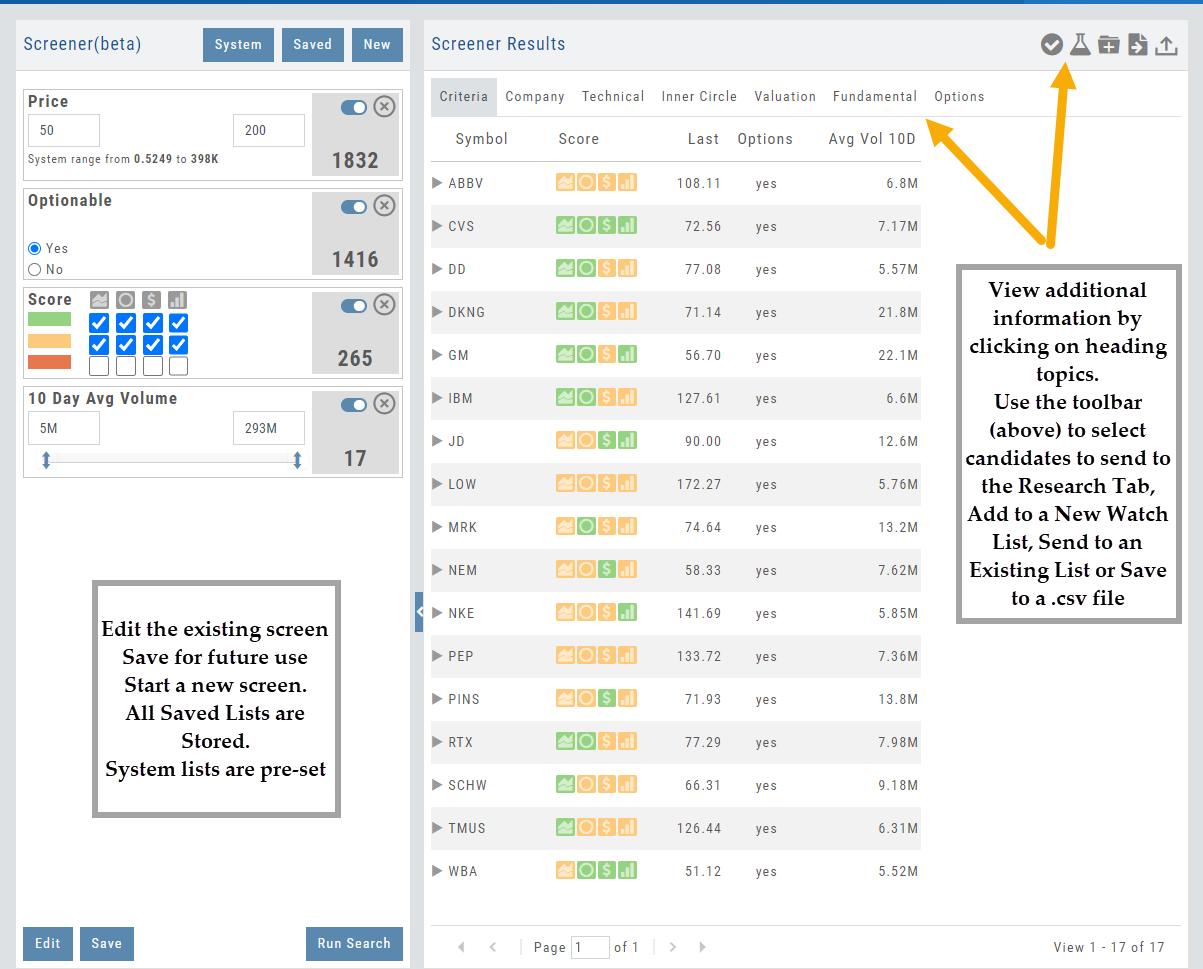
The criteria selected in this example were Price ($50-200), Optionable, Score (Green or Yellow for each Icon), and 10-day Average Volume (5M-293M) resulting in 17 candidates.
From here, using the Icon Toolbar, candidates can be selected and:
- Sent to Research for further analysis
- Sent to an existing Watch List
- Used to create a New list
- Can be downloaded to a .csv file.
The Screen itself can be Saved (and named), or further modified – either by
adjusting the existing criteria or adding new data points – or a New Screen
can be created.
Additional data is accessible by clicking on “Company”, “Technical”, etc
above the list of candidates.
Icon Tool Bar – Hover Cursor over Icon to view function
Select one or more symbols
Send selections to Research
Create a New Watchlist with Selected Candidates
Send Candidate to an Existing Watchlist
Download to .csv file
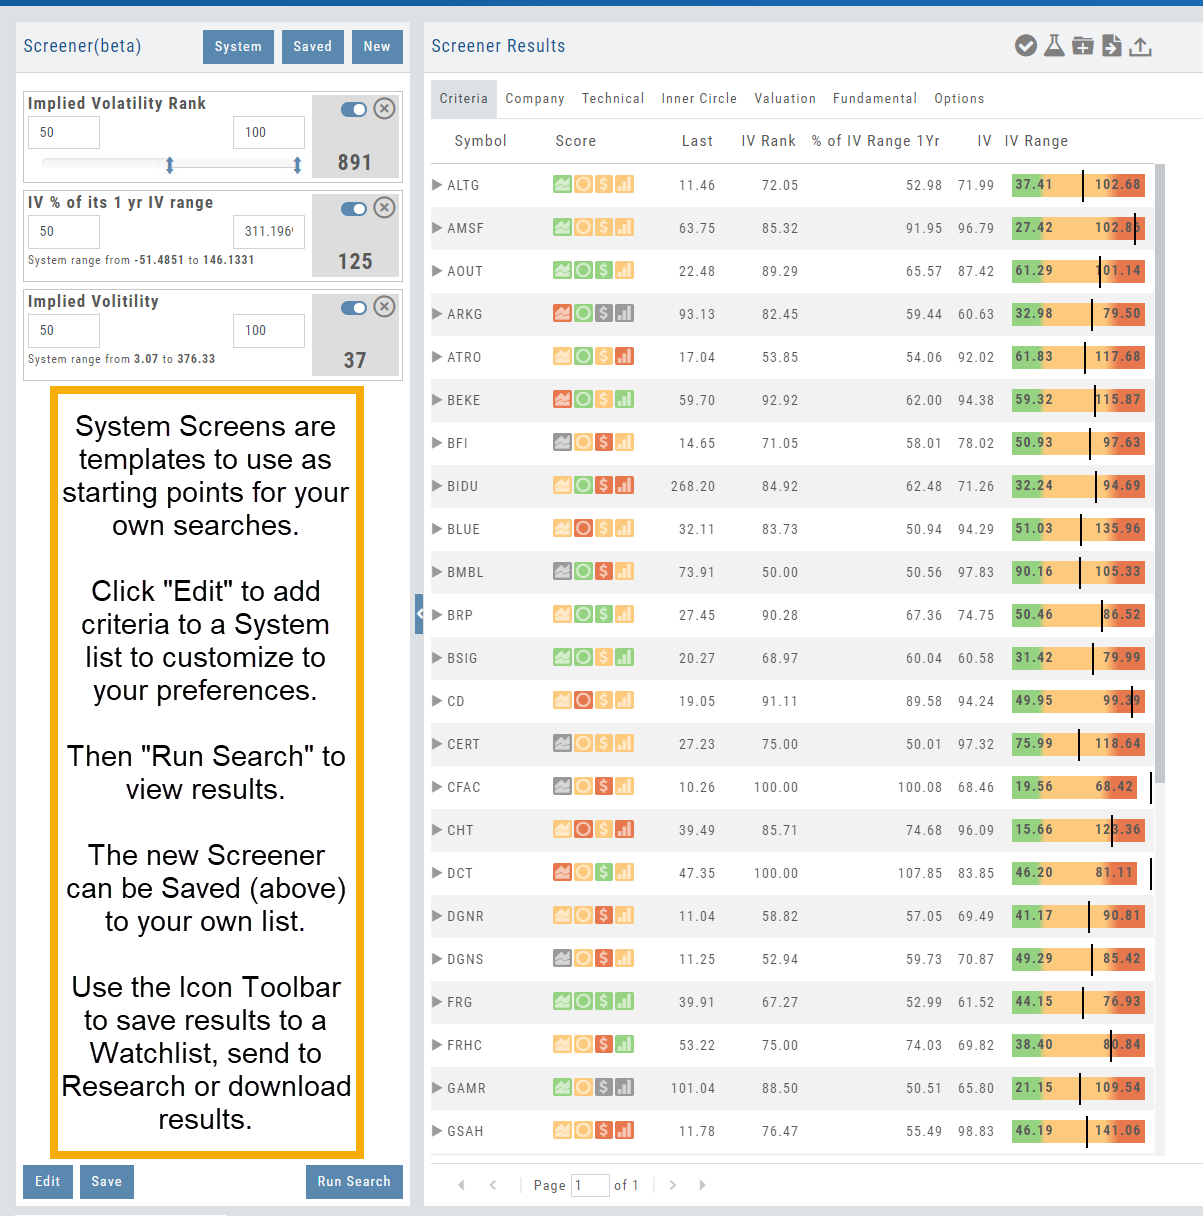
System Screens are also available and new ones will be added.
The user can customize such screens and save to the platform just as any other
screen.
Candidates can be sent to Research, to a Watch List and/or
downloaded to a .csv file.
System Screens themselves cannot be modified and are designed to be
‘launching points’ for the user’s convenience if they wish to use them.
Note the colored bar graph of IV Range. It provides a ‘picture’ of where this
Stock/ETF is now for this datapoint.
Edit Screeners
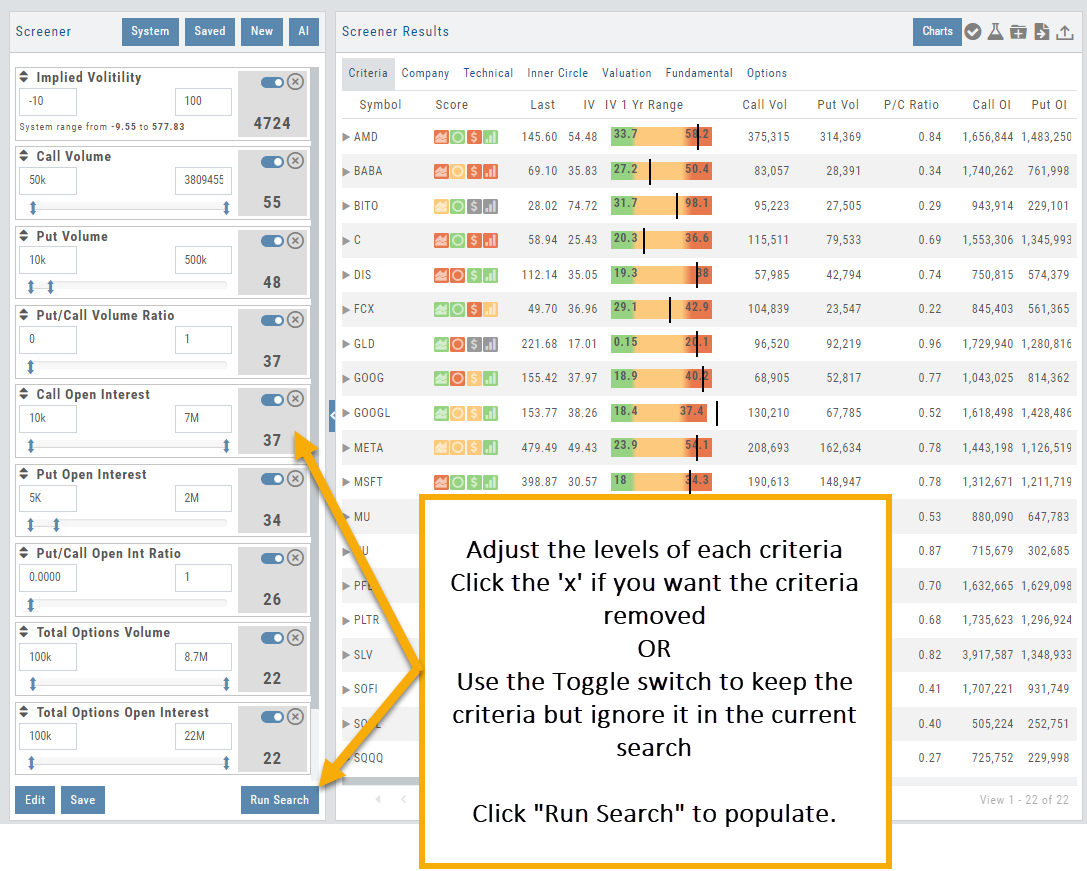
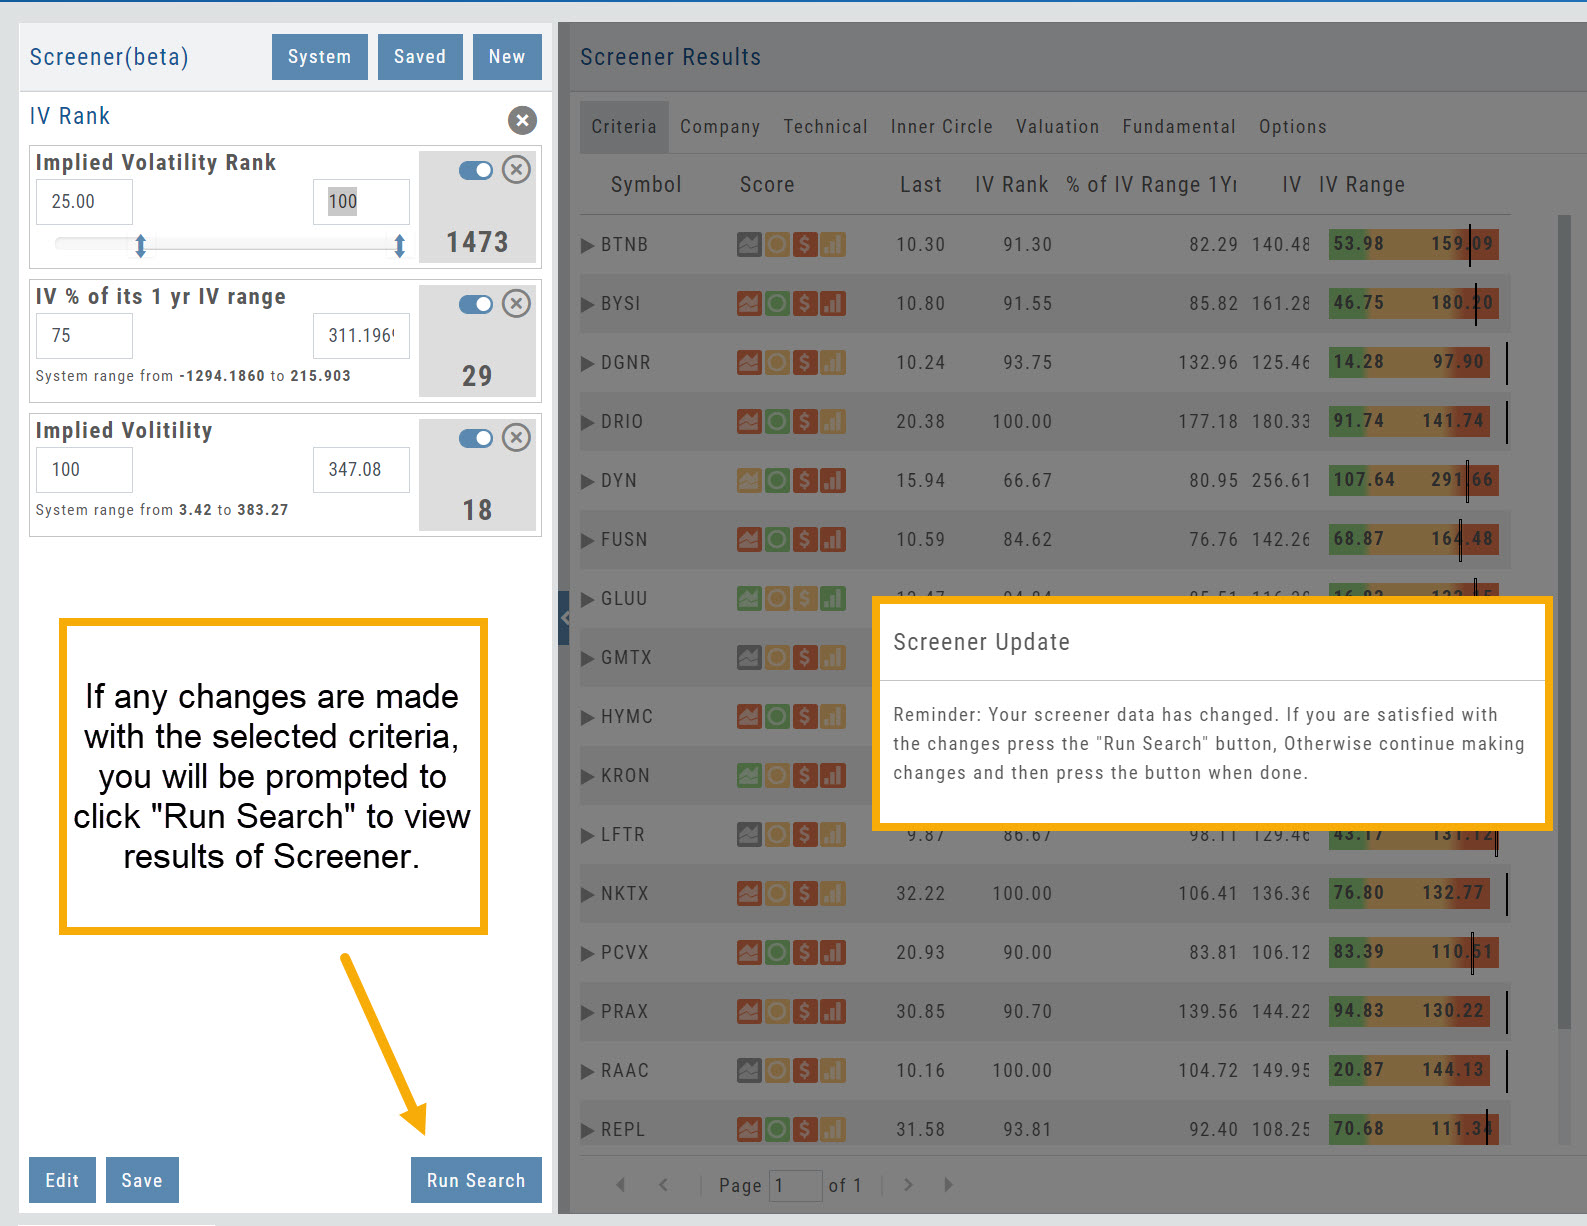
Edit current, Saved or System Screeners by adjusting parameters of existing criteria using the slide bars, entering values in boxes, etc.
A Screener Update notice will appear prompting you to select “Run Search” after adjustments are completed. Updated results will populate the left table.
From here, use the Icon Toolbar for further options: Select, Add to Watchlist, Research or Download.
Toggle Criteria
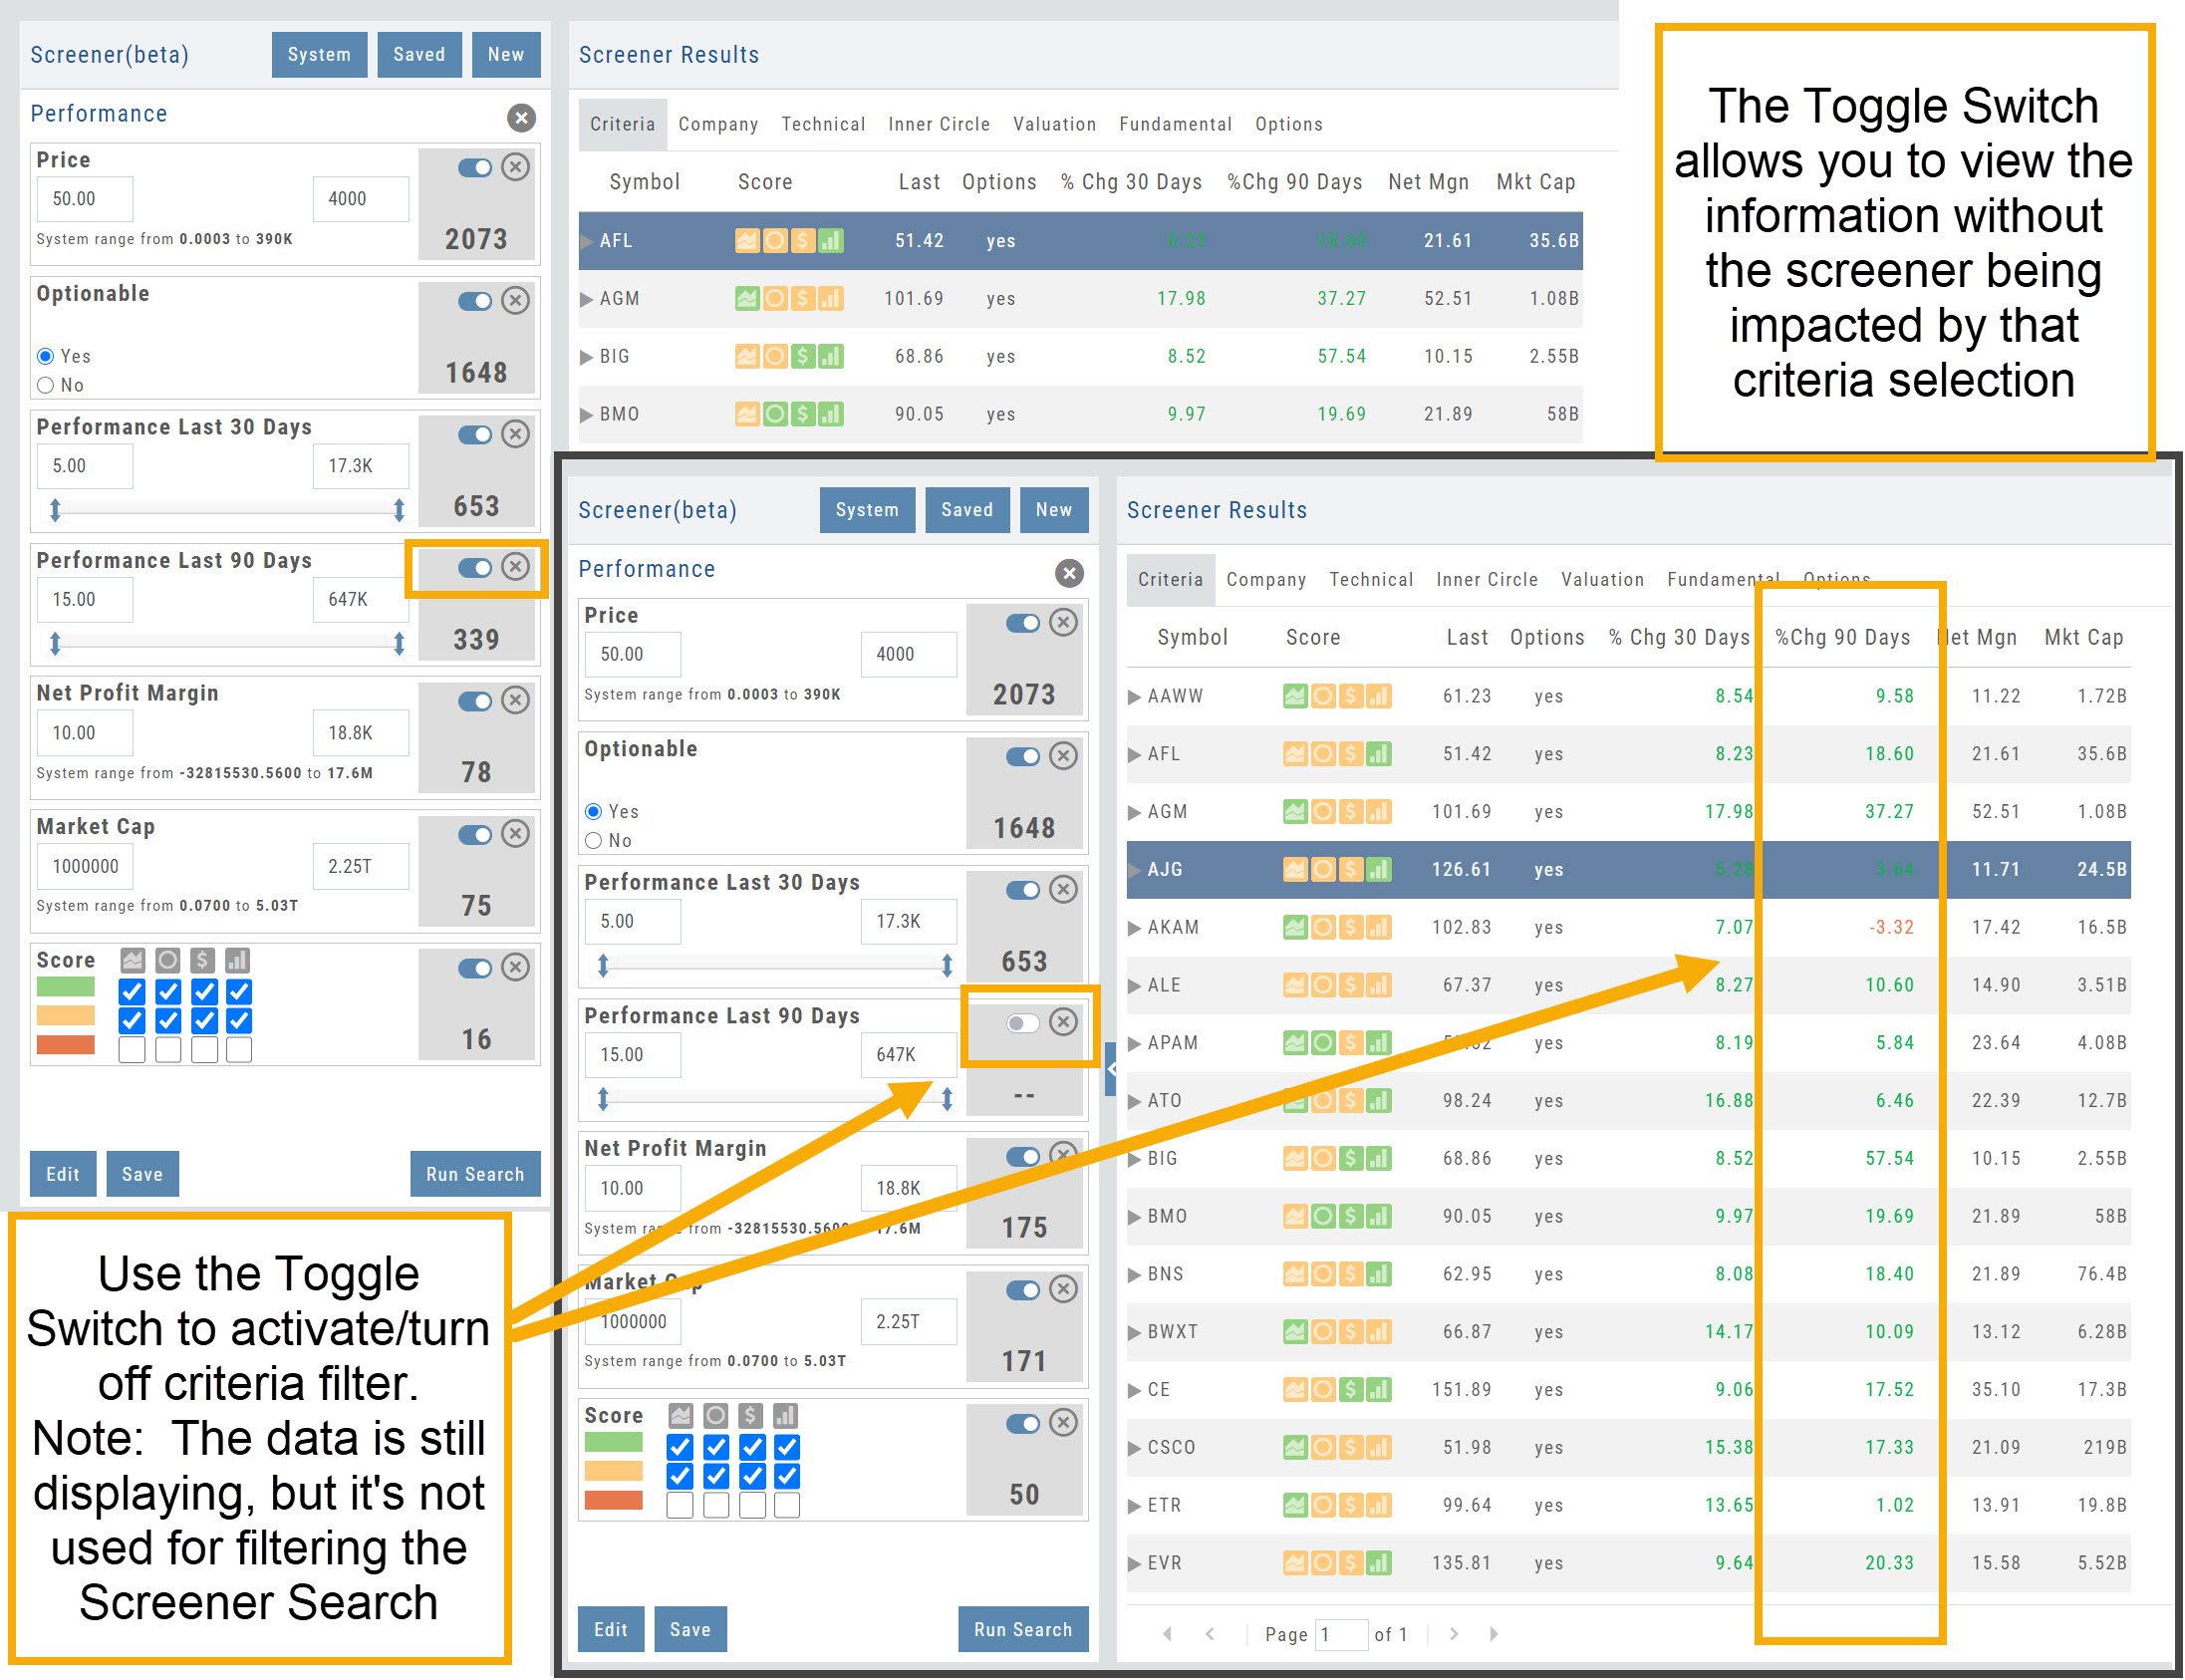
The Toggle feature gives you additional flexibility in your Screener searches.
The ON position includes the selected criteria in calculating results.
The OFF position for that criteria will not affect the results when used to filter results. However, that data column will still be displayed with the other points selected.
Calendars
Earnings and dividend calendars — what’s coming, and how past earnings performance reads.
Calendars
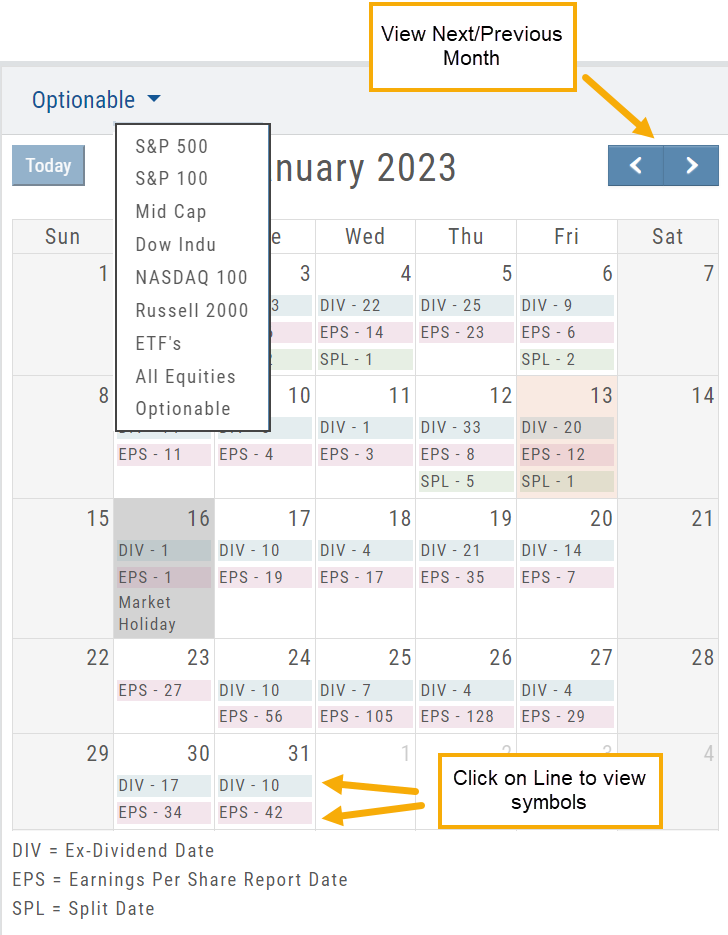
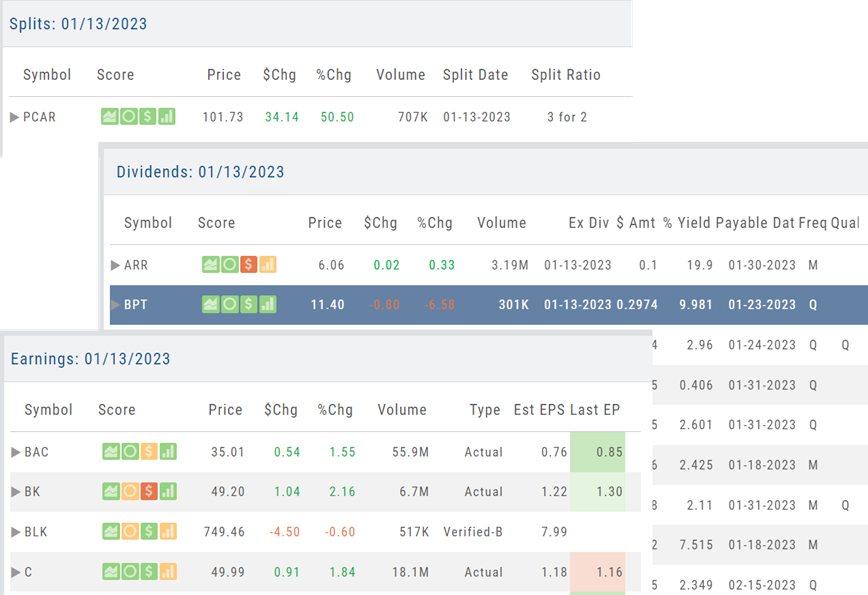
Under the “Find” Tab, Calendar allows one to search for company’s Dividends, Earnings or Splits.
Select “DIV”, “EPS”, “SPL” by calendar date. Use the drop-down menu on the upper left corner to select S & P 500 stocks, All Equities, Optionable, etc.
Use the navigational buttons on the upper right, above the calendar to move the time period forward or back.
Once selected, the stock symbols will automatically populate the right side of the screen. The navigational icons, allow you to perform such functions as select/adding/managing icons to send to a Watchlist or to Research, you can also further Filter candidates.
Earnings Per Share Performance
Once a date has past and earnings have been announced, Earning Per Share (EPS) is color-coded based on how much the company beat (or missed) Expectations.
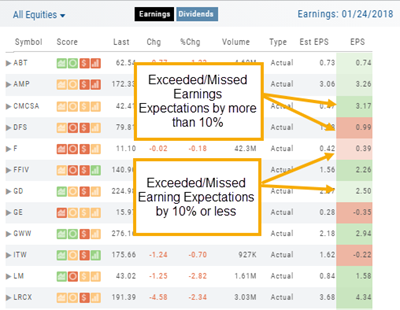
Go to Find>Calendar, select “Earnings” and view any past date, where earnings have been announced, to view the results.
Dark Green/Dark Red is considered surprise, and indicate the company beat/missed estimates by more than 10%
Light Green/Light Red indicate the company beat/missed estimates by 10% or less
The AI tools
Ask the Financial Coach for market context, or let Screener AI draft criteria you can inspect and refine.
AI capability: Financial Coach
Use the Power of AI with a Financial Market Coach. Some of the applications include:
- Insight on trading strategies and applications
- Guidance on Risk Management techniques
- Market trend analysis
- Information access covering technical to fundamental access
- Management guidance to minimize risk and optimize returns
Located within the Find Tab, this powerful research tool can gather and deliver market-related information while staying within the platform.
- Select feature from the Find Tab
- Type your inquiry in the “Ask me anything” box
- Click “Send“. Refine by submitting additional questions, clicking “Send” after each one.
- To start a new Chat, click the “New Chat” button by the same name.
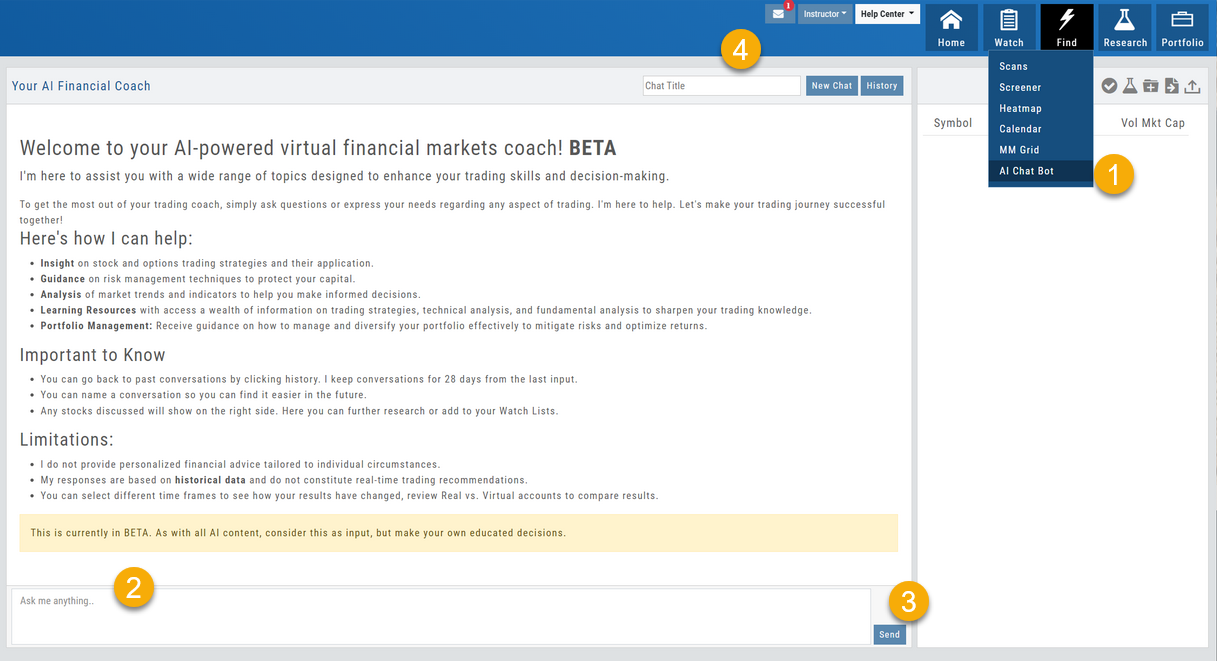 AI Chat Bot: the welcome screen listing how it can help (insight, guidance, analysis, learning resources, portfolio management), things to know (history kept 28 days, name your conversations, discussed stocks appear on the right), its limitations, and the Ask me anything box” class=”wp-image-795″/>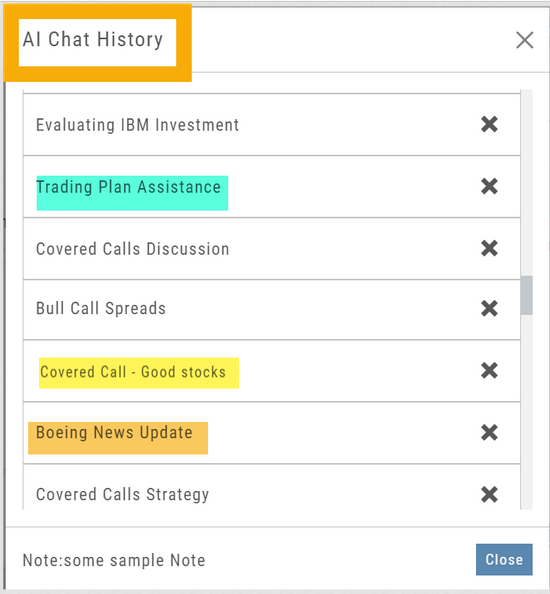
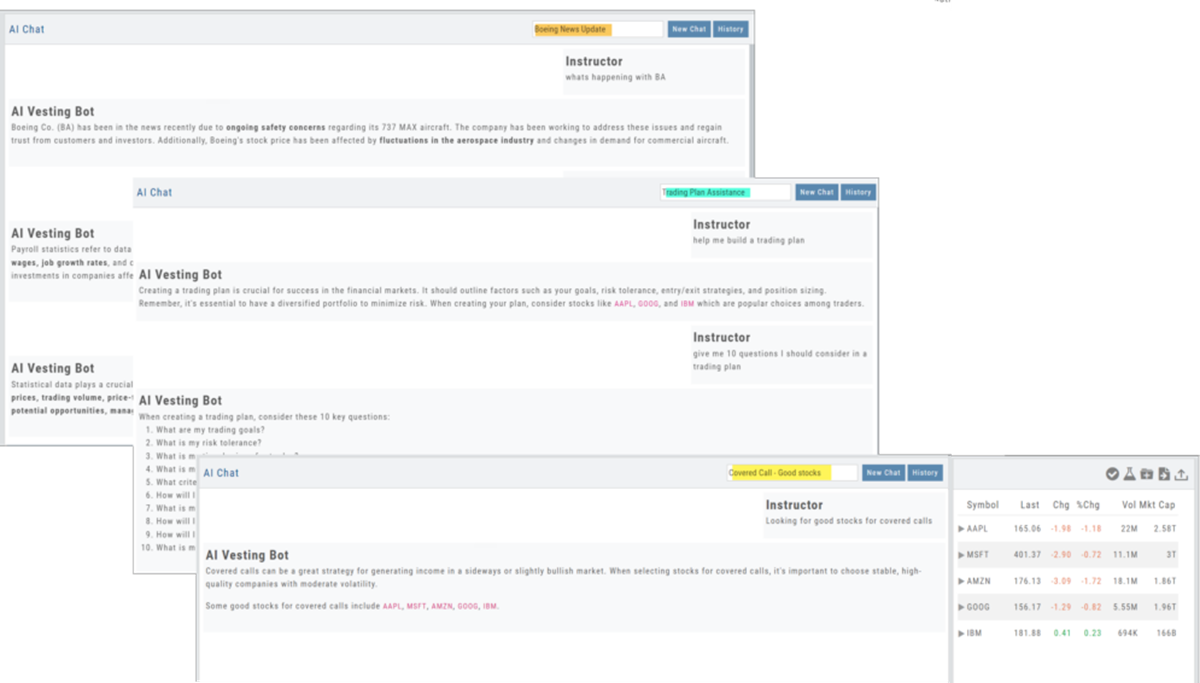
Each Chat result is automatically saved and accessed via the History button. The title is auto-generated based on the topic when the Chat is created. You can edit the title at any time.
Inquiry results that include symbols will be displayed on the right panel of the screen, allowing the ability to navigate to other areas of the platform for that symbol.
To remove any Chat, simply click the ‘x’ for that entry.
AI capability: Screener
Screener AI Assistant helps power your Research. Here are just a few ways how:
- Get criteria for customized screens based on market outlook, strategies and goals
- Learn about different strategies and how to apply them to your screener
- Interact and Refine screens for a tailored investment strategy
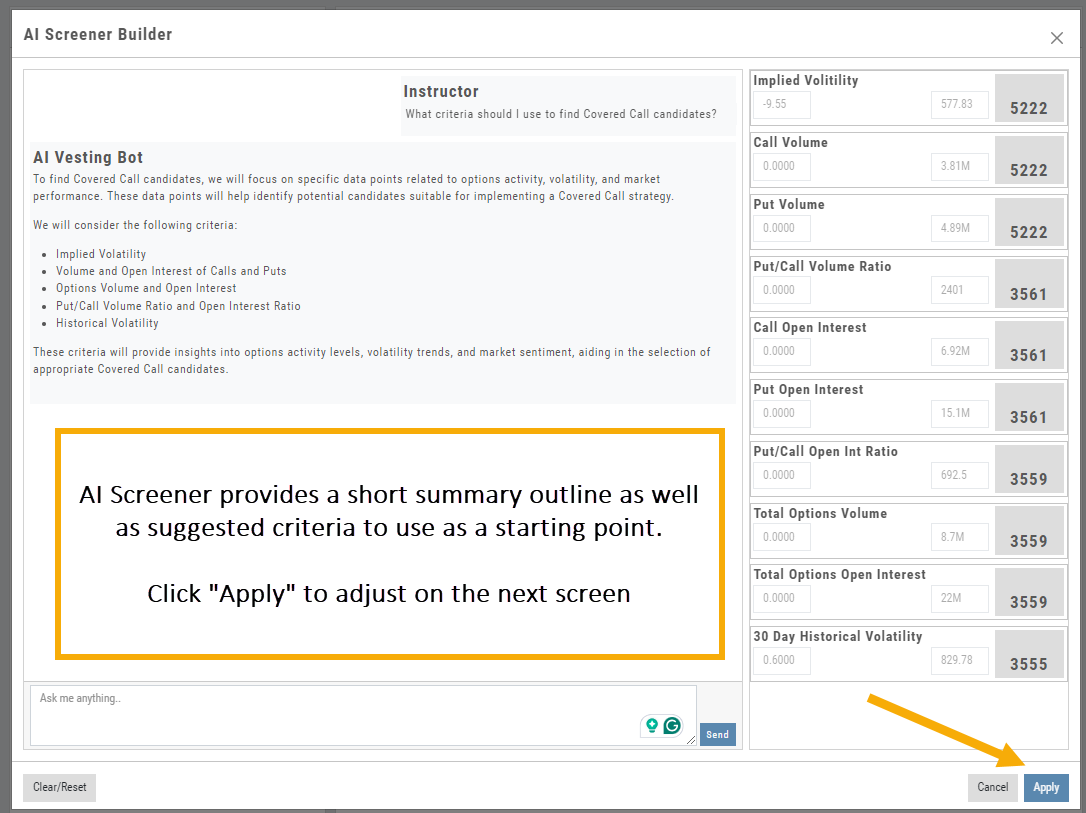
Located on the Screener page (under the Find Tab), click the AI button to enter your inquiry in the “Ask Me Anything” box at the bottom of the table, then click “Send“.
Example: What criteria should I use to find Covered Call candidates?
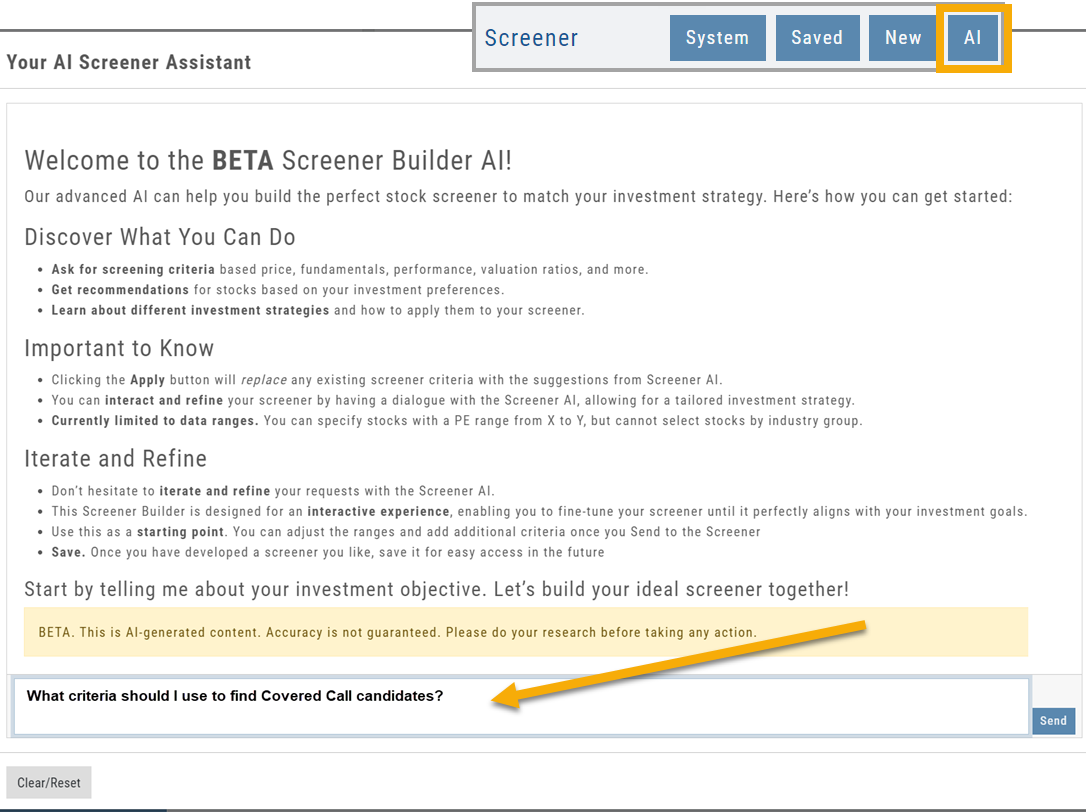
The Screener AI functions allow you the control to:
- Remove or Ignore suggested datapoints
- Save Screener AI searches
- Revise/Delete as needed