
The Market tab
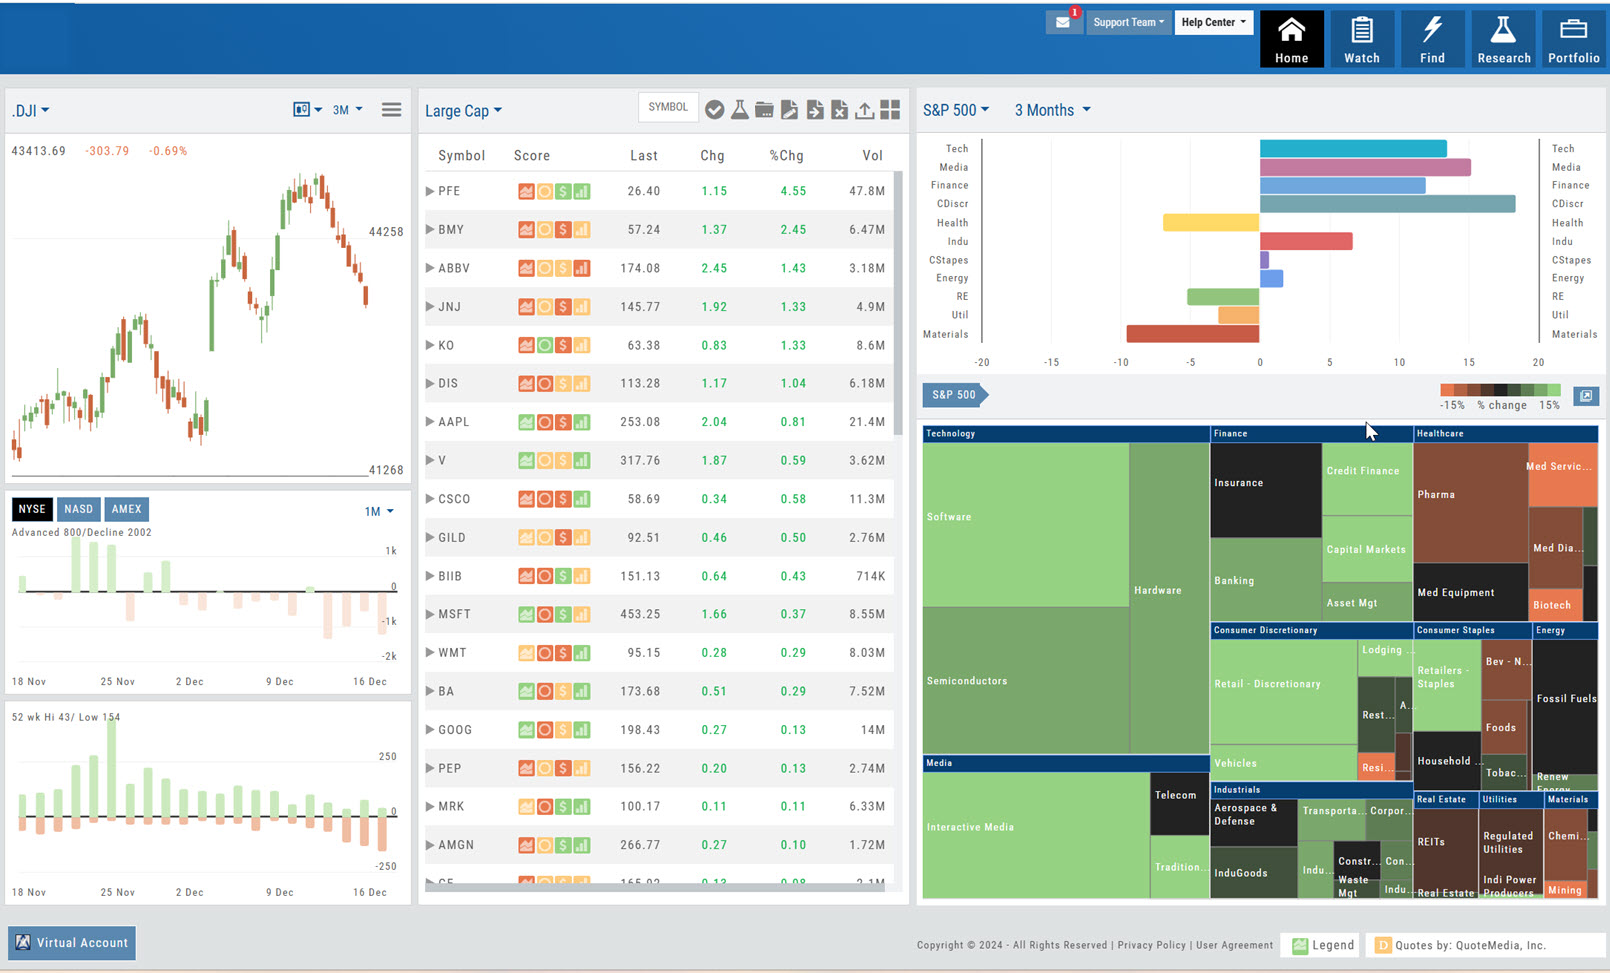
You can search for symbols from several entry points including "Market" and "Watch".
Read the full articleView the broad market in a single view Various market views available View in various time frames Identify Sectors and Industry Group money movement
Click to launch Help Center The Help Center has a User Guide , Video Library, Quick Guides , Register for Office Hours and Platform Training Webinars or create a Support Ticket
features include: Go to Account Settings Go to Help Center Create a Support Ticket Select Platform Theme/Background
Read the full articleCustomized per symbol. Each icon provides navigation to the appropriate Research tab.
Clicking on the stock symbol will take you directly to \\\\\\\\\\\\\\\'The Dashboard" under the \\\\\\\\\\\\\\\'Research\\\\\\\\\\\\\\\' Tab.
The Action Icon is found throughout the platform and offers actions based on where you are located in the platform.
Click on the down \\\\\\\\\\\\\\\'arrow\\\\\\\\\\\\\\\' to select any of your Managed or Dynamic lists. You can easily switch between any of these lists.
Change from Chart to List view.
Select brokerages like Schwab, ChoiceTrade, E*Trade, Tradier, with more to follow. Virtual and Manual Accounts allow you to practice trading.
Click for full page view of Heat Map and Market Spectrum Spectrum view has more detail, too.
Icon Toolbar Hover mouse/cursor over each icon to display it\\\\\\\\\\\\\\\'s function. Examples: Select, Send to Research, Add/Delete a Watchlist, etc.
This graph changes dynamically with the Heat/Spectrum map and time period selected. Change the View (S&P 500, S&P100, Dow Jones, etc) Change the Time Period (Day, Week, Month, 3 Months, etc) The center of the graph is neutral. Left is Bearish. Right is Bullish.
Select views of the Dow, NASDAQ, the S&P 500 and/or the Vix by various time frames.
These graphics provide information on a possible Rally or Sell-Off as well as provide confirmation of a possible Market Trend. Select by time-frame
Enables you to receive emails on upcoming Expirations, Dividend and Earning announcements for current Positions in your Portfolio.
Don’t Know the Symbol?
No Problem
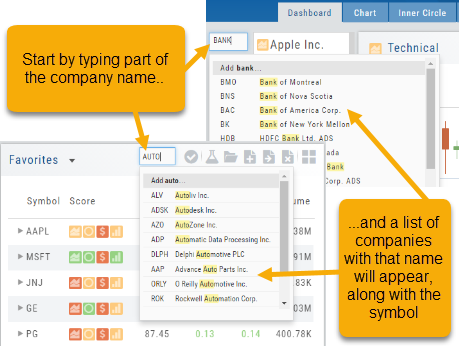
You can search for symbols from several entry points including “Market” and “Watch”. Simply start typing all or part of the Company’s name and the system will proactively provide you with suggestions. You can use this feature anywhere including Insiders and Institutions.
For example, typing “Bank” in the Symbol box will bring up the stock symbols and names of companies with “bank” in their name.
Depending where you are in the Platform, clicking on the selected symbol while you are in:
The “Market” or “Watch” tab, it will be added to your currently open list of stocks.
The Dashboard of the “Research” Tab, it will automatically provide the top layer of information on the stock. As always, you are able to navigate to different areas or ‘drill down’.
Insider or Institutions of the “Research” Tab, the corresponding data will display, such as data by Quarter, the biggest buyers and sellers and more.
User Menu
Take a tour, have a question, change the theme – all from one place.
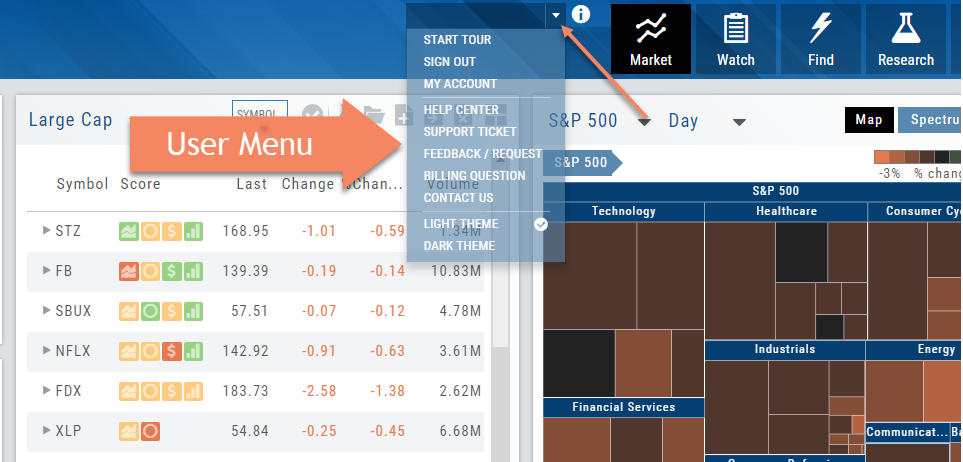
The User Menu is one of the 6-point Navigation system of this trading platform. You can access The Help Center from here, ask a support question, check your account, suggest a feature idea or provide feedback on the platform, even change the platform ‘theme’ (example “light” or “dark”) and more.
Mobile — Market Summary
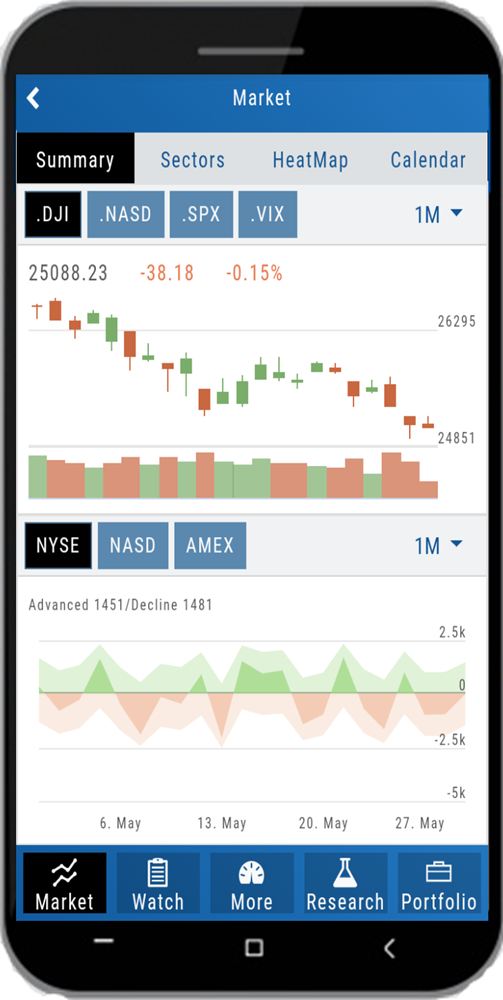
# of Advanced/Declined Stocks for current day by Exchange selected
Slide finger or stylus vertically along x-axis for daily Advanced/Declined numbers for the selected Exchange
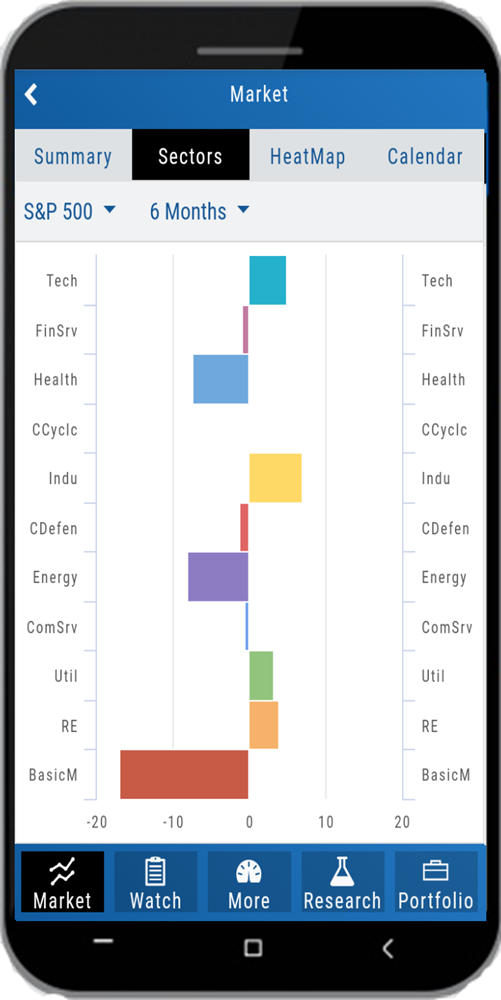
Mobile — Sectors
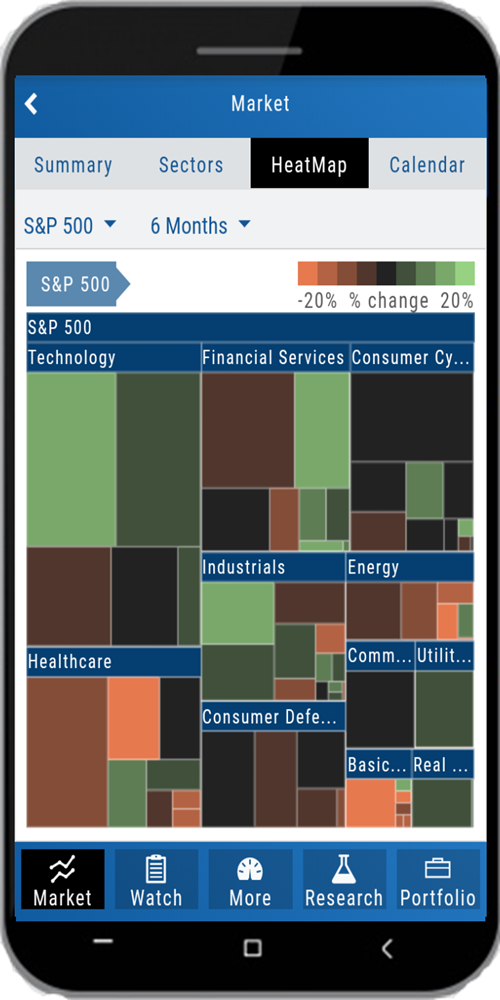
Mobile — HeatMap
Mobile — Calendar
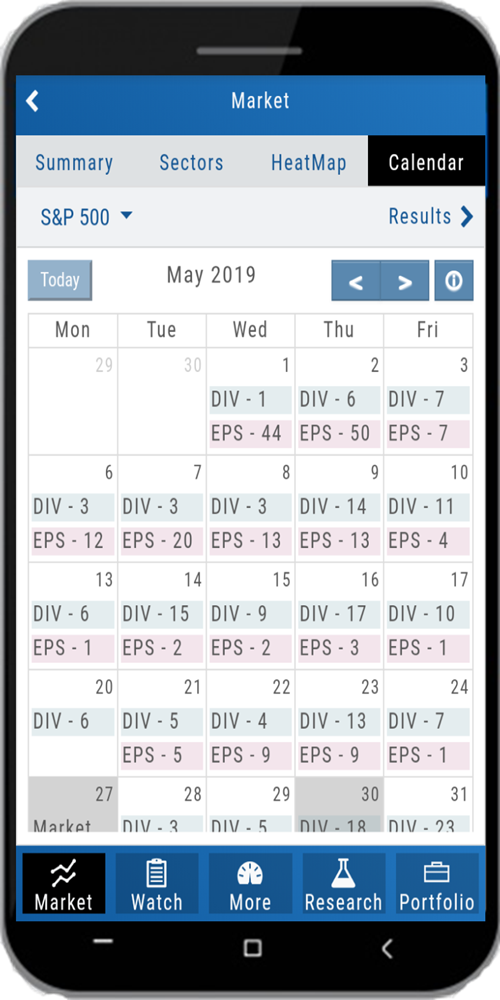
Click any Date box for results Or click on "Div" or "EPS" for only those results. You can view in List or Tile and add symbols to a watchlist