
Scans
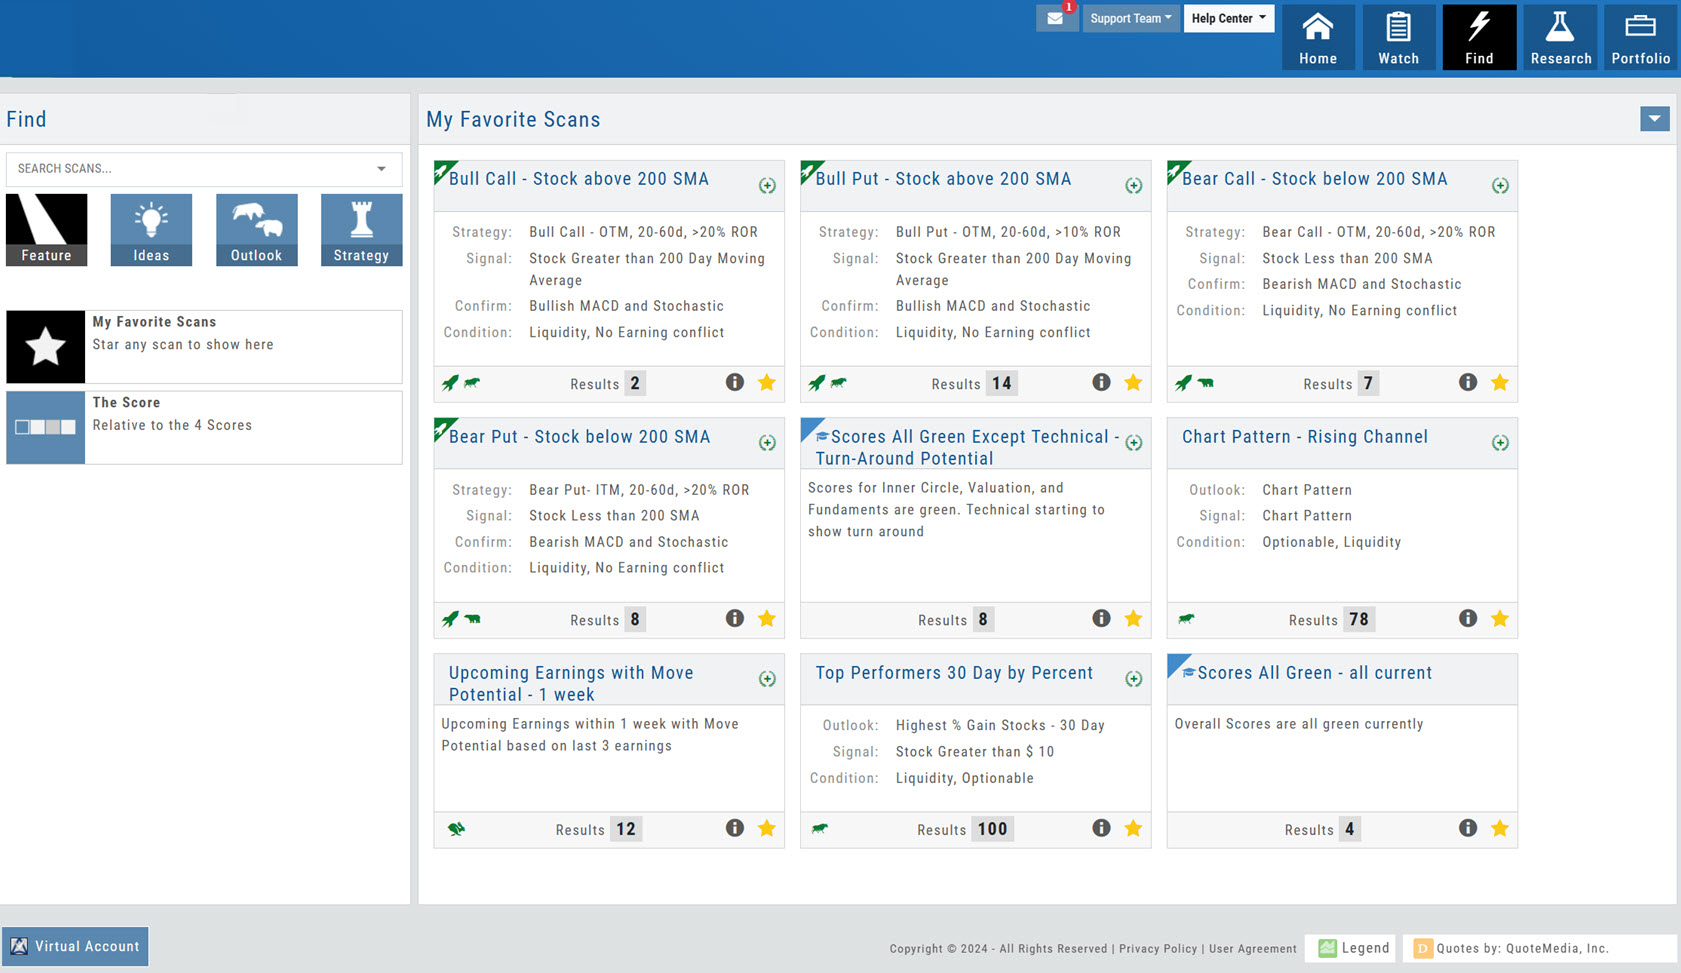
You can drill-down for scans by Category, Sub-Categories, then Group. The category names may differ, but the scans remain the same.
When is clicked on any scan or list result, it is automatically saved under "My Favorite Scans", eliminating the need to search for them.
The icon indicates this scan has an Option Strategy Template.
Some scans are identified by outlook icons such as: Bullish Bearish Stagnant Volatile
The Action (Arrow) icon will provide different actions depending on where you are in the platform.
Read the full articleClick to expand/collapse Option Strategy box to view/hide strategy description, signal, confirmation and condition information.
Open/collapse by clicking on icon in upper right corner of screen
Premium Scans are available to students enrolled in Premium Education Programs.
Displays number of candidates meeting initial criteria of scan.
Click the Info icon to expand/collapse information on strategy.
Other Navigation
Icons = Navigation
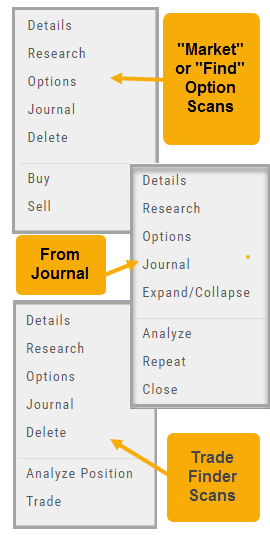
The Action (Arrow) icon will provide different actions depending on where you are in the platform. For example if you are in the Market or Find tab, ‘Detail‘ will provide a Quote Popup. ‘Research‘ will take you to the Dashboard – overview – of the stock. ‘Options‘ will take you to that part of the platform etc.
When in a “Trade Finder Scan” (identified by the  icon), the Action icon choices include: ‘Analyze Position‘ which will take you to the Options tables and/or ‘Trade‘ which will lead you to the Order Ticket of the Brokerage Account from the menu.
The Action Icon is also found in the Journal. Under the “Positions” tab, clicking on the icon allows you to Expand/Collapse details of the trade, Analyze or Close the trade among other choices.
Scan results
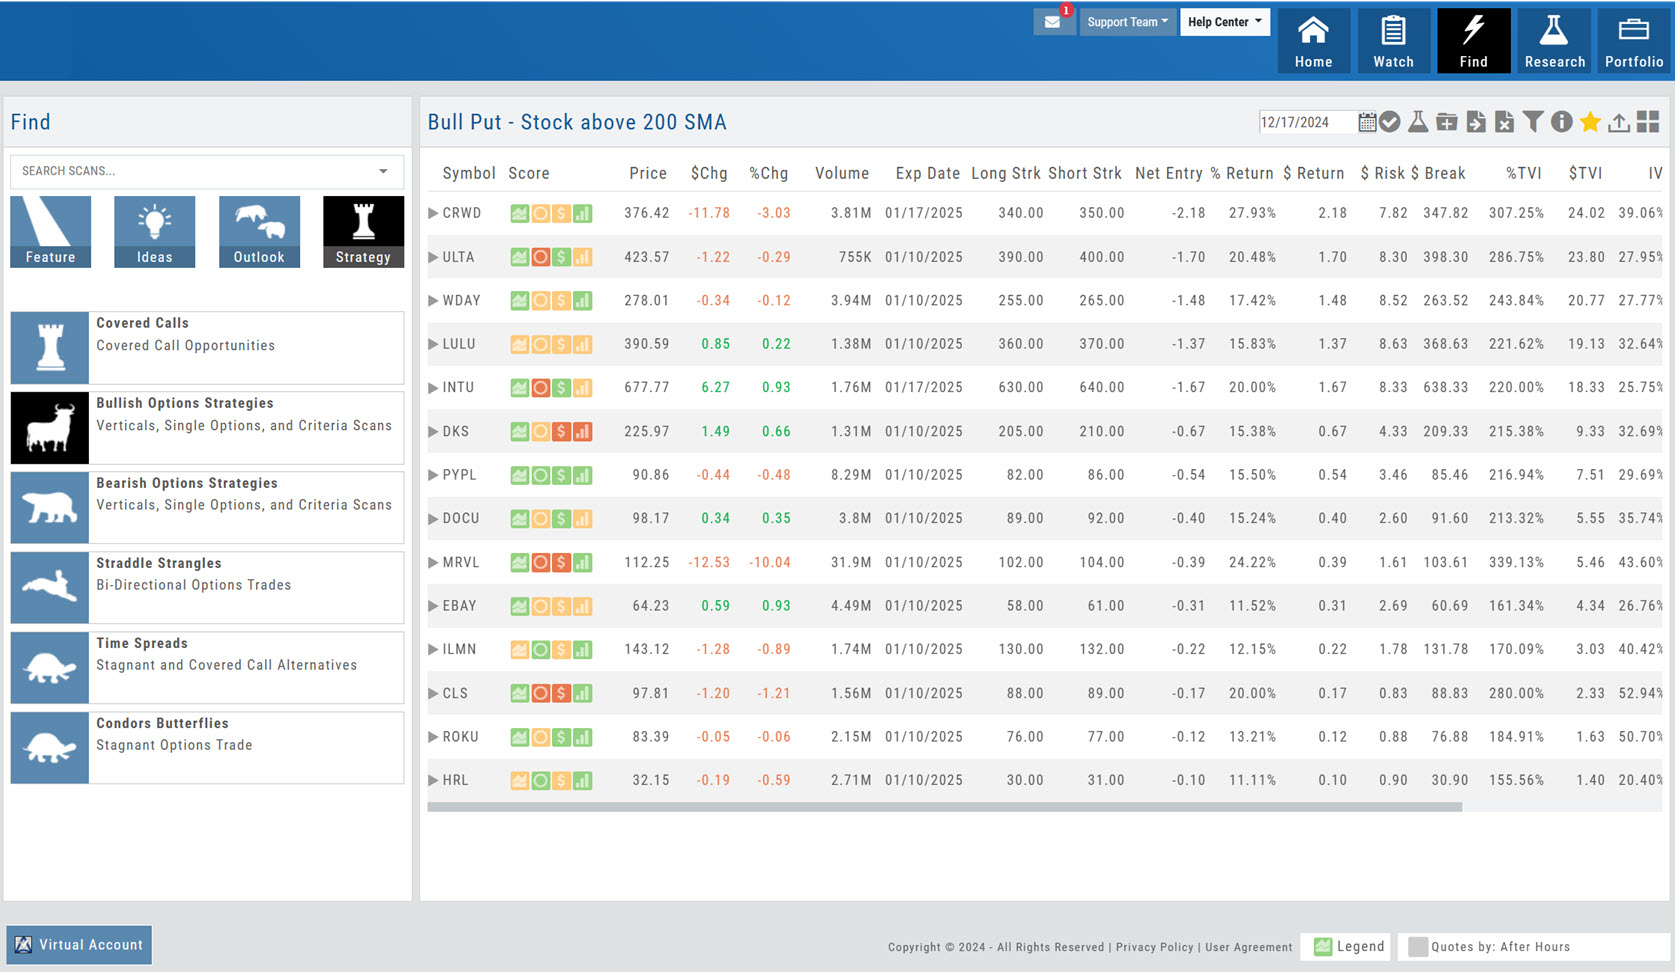
From the results page, you can further research the initial trade candidates using criteria such as volume, price, % change, etc.
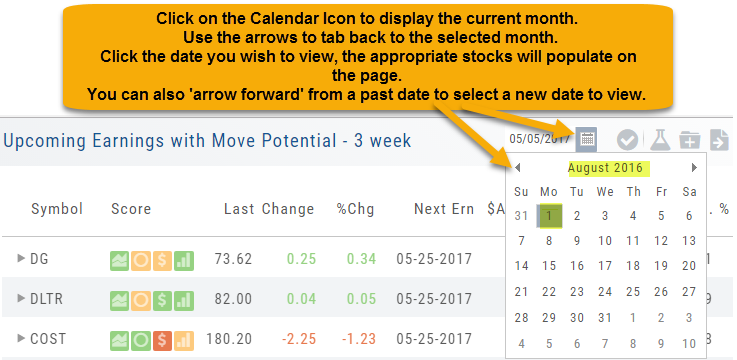
Tip: To select previous date, click on calendar icon, then click on Month (ex: July), then select Month tab or arrow back by Year.
Read the full articleThe Action Icon on Trade Finder Scans allows actions such as: Analyze the position from the Option Tab Trade the current position
Offers 1 Day, 1, 3 & 6 Month views as well as Small, Medium and Large tile sizes to assist with researching trade candidates.
Read the full articleSort by clicking on any column header including Symbol and Score
Icon Toolbar Hover cursor/mouse over each icon to view function including Select, Research, Manage, Filter, add to Favorites, download to csv file, etc.
Past Scan Results
When viewing scan results, you can select a past date by clicking on the Calendar Icon, then the back arrow until you get to the month you want to search from. Click on the date you wish to view & the appropriate stocks will populate the screen.
The date you are searching will be displayed in the header.
Note: Past Scans availability dates vary. When a new scan is added, the history is available from the day it was added to the platform going forward.
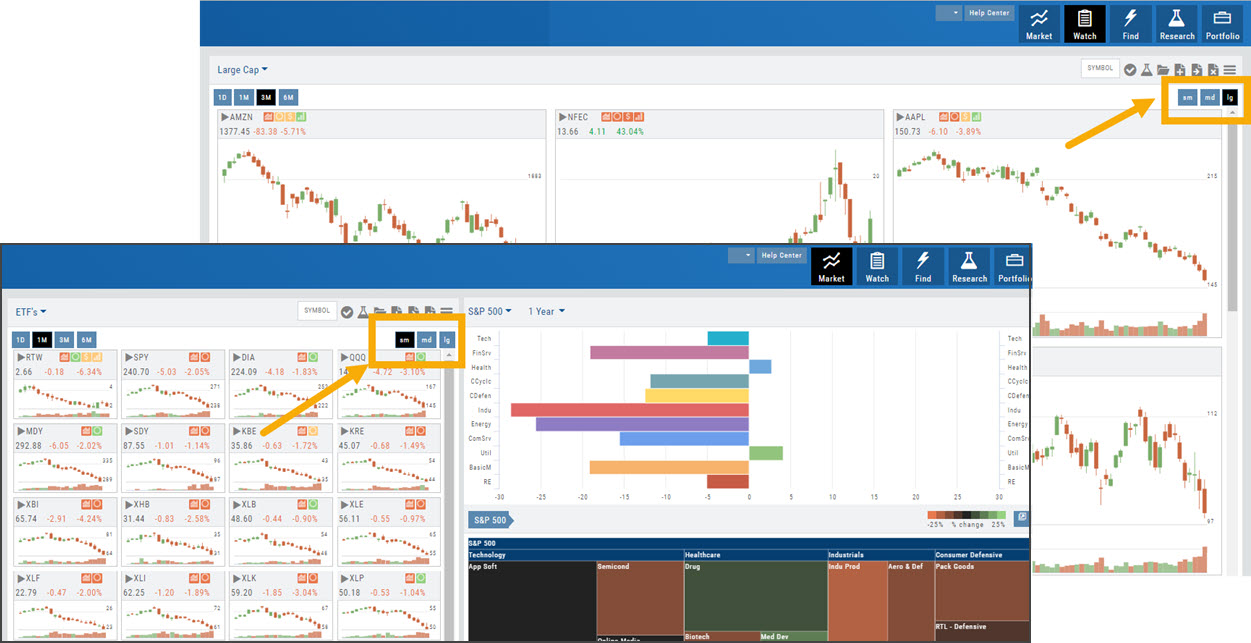
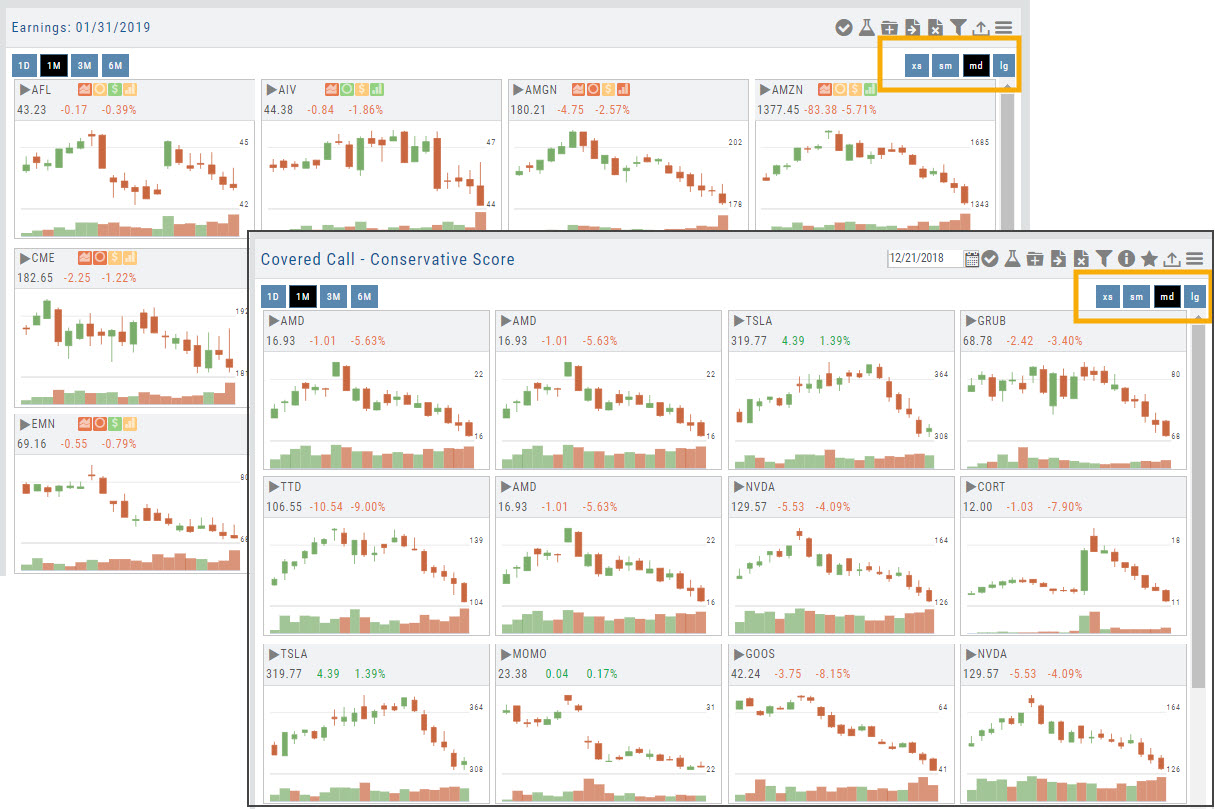
Tile View Sizes
Tile View is available in 3 sizes on the Market or Watch Tabs.
Scans and Earnings/Dividends Calendar under the Find tab offer 4 Tile View sizes: Extra Small to Large.
The platform’s adaptive and responsive technology will automatically adjust the number of tiles shown based upon the available space as well as allow continual scrolling for large lists.
Heat Map
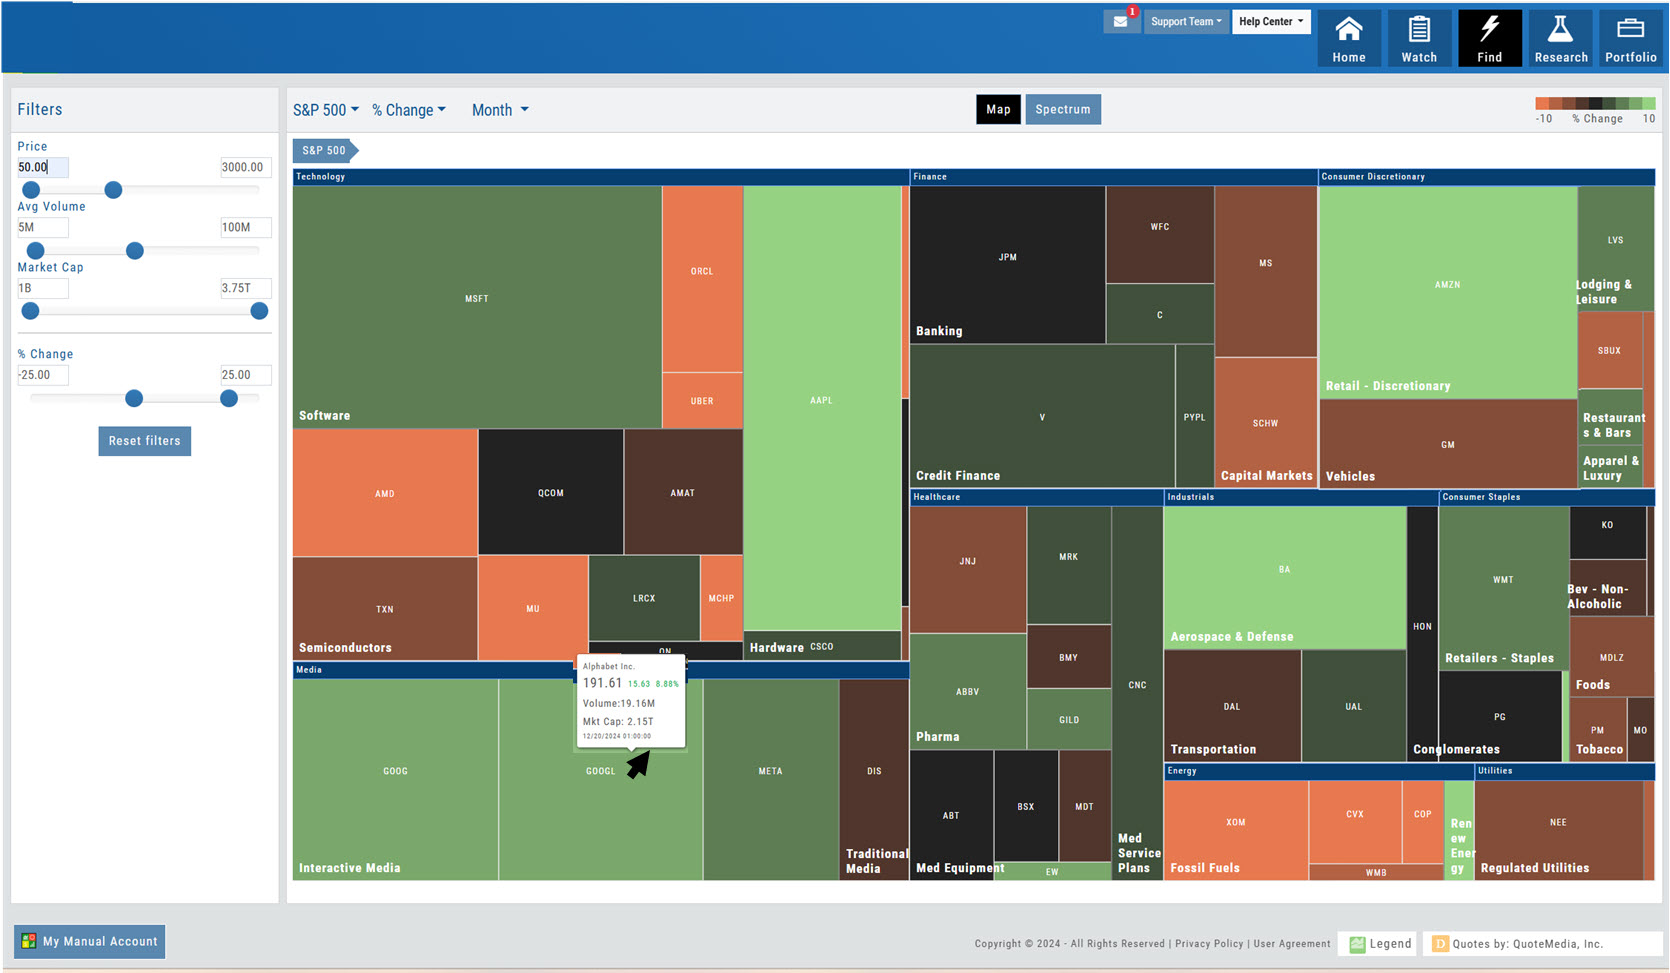
Filter results by Price, Average Volume, Market Cap , and the criteria view selected (Example: % Change ) Reset Filter restores all candidates in current view: all stocks in S&P 500
As you drill-down the Heat Map or Spectrum view, the line of \\\\\\\\\\\\\\\'breadcrumbs\\\\\\\\\\\\\\\' lengthens. Click on any \\\\\\\\\\\\\\\'breadcrumb\\\\\\\\\\\\\\\' and be taken back to that section.
You can view the Map or Spectrum by selected Index, ETFs or a list of Optionable Stocks.
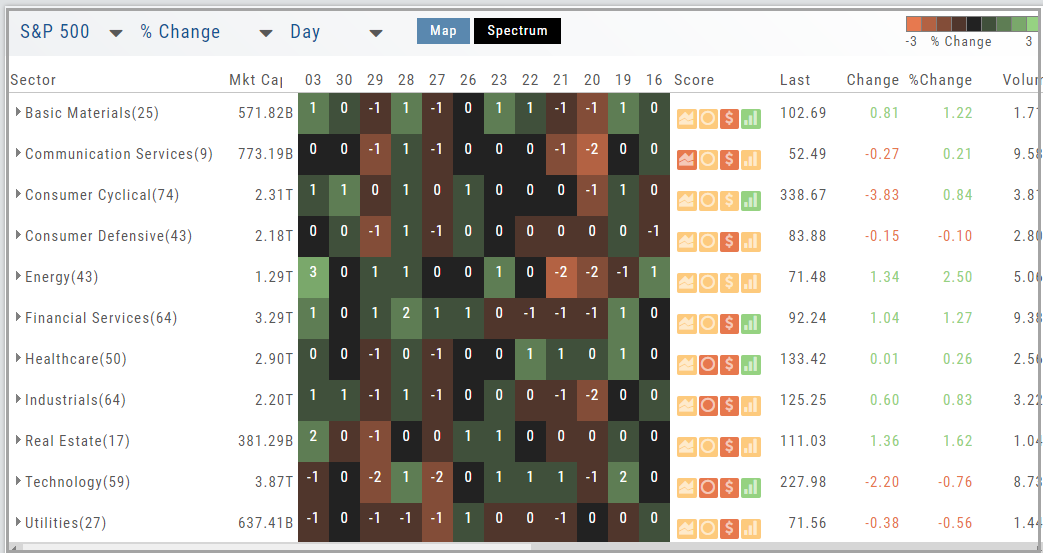
Click "Spectrum" for an alternate view of your selected Index, criteria and time period.
Click \\\\\\\\\\\\\\\'Industry\\\\\\\\\\\\\\\' for broader view
The Legend dynamically updates with the criteria select (Index, time-frame, etc)
Market Cap determines symbol box size. Hover Cursor over box for a summary of that symbol.
Spectrum view
Clicking on any of the icons will navigate you to that part of the platform
The Legend shows the % range of negative or positive change represented by a color spectrum. It adjusts dynamically to the data filters you select for the Heat or Spectrum Maps. Clicking on the legend will show specific range of each color in the spectrum and give additional information about the definition.
Click to display Industries within the Sector, then companies within the Industry. Click again to close.
Shows the number of companies within the sector. You can drill-down: Sector>Industry>Company
Each box represents a unit of the selected time frame (ex: Day, Week, Month) The number in each box represents where it falls on the corresponding Legend.
This criteria dynamically updates the corresponding Legend.
Time Frame Each box of the Spectrum view represents a 'slice' of the selected frame. This criteria dynamically updates the corresponding Legend.
Calendar
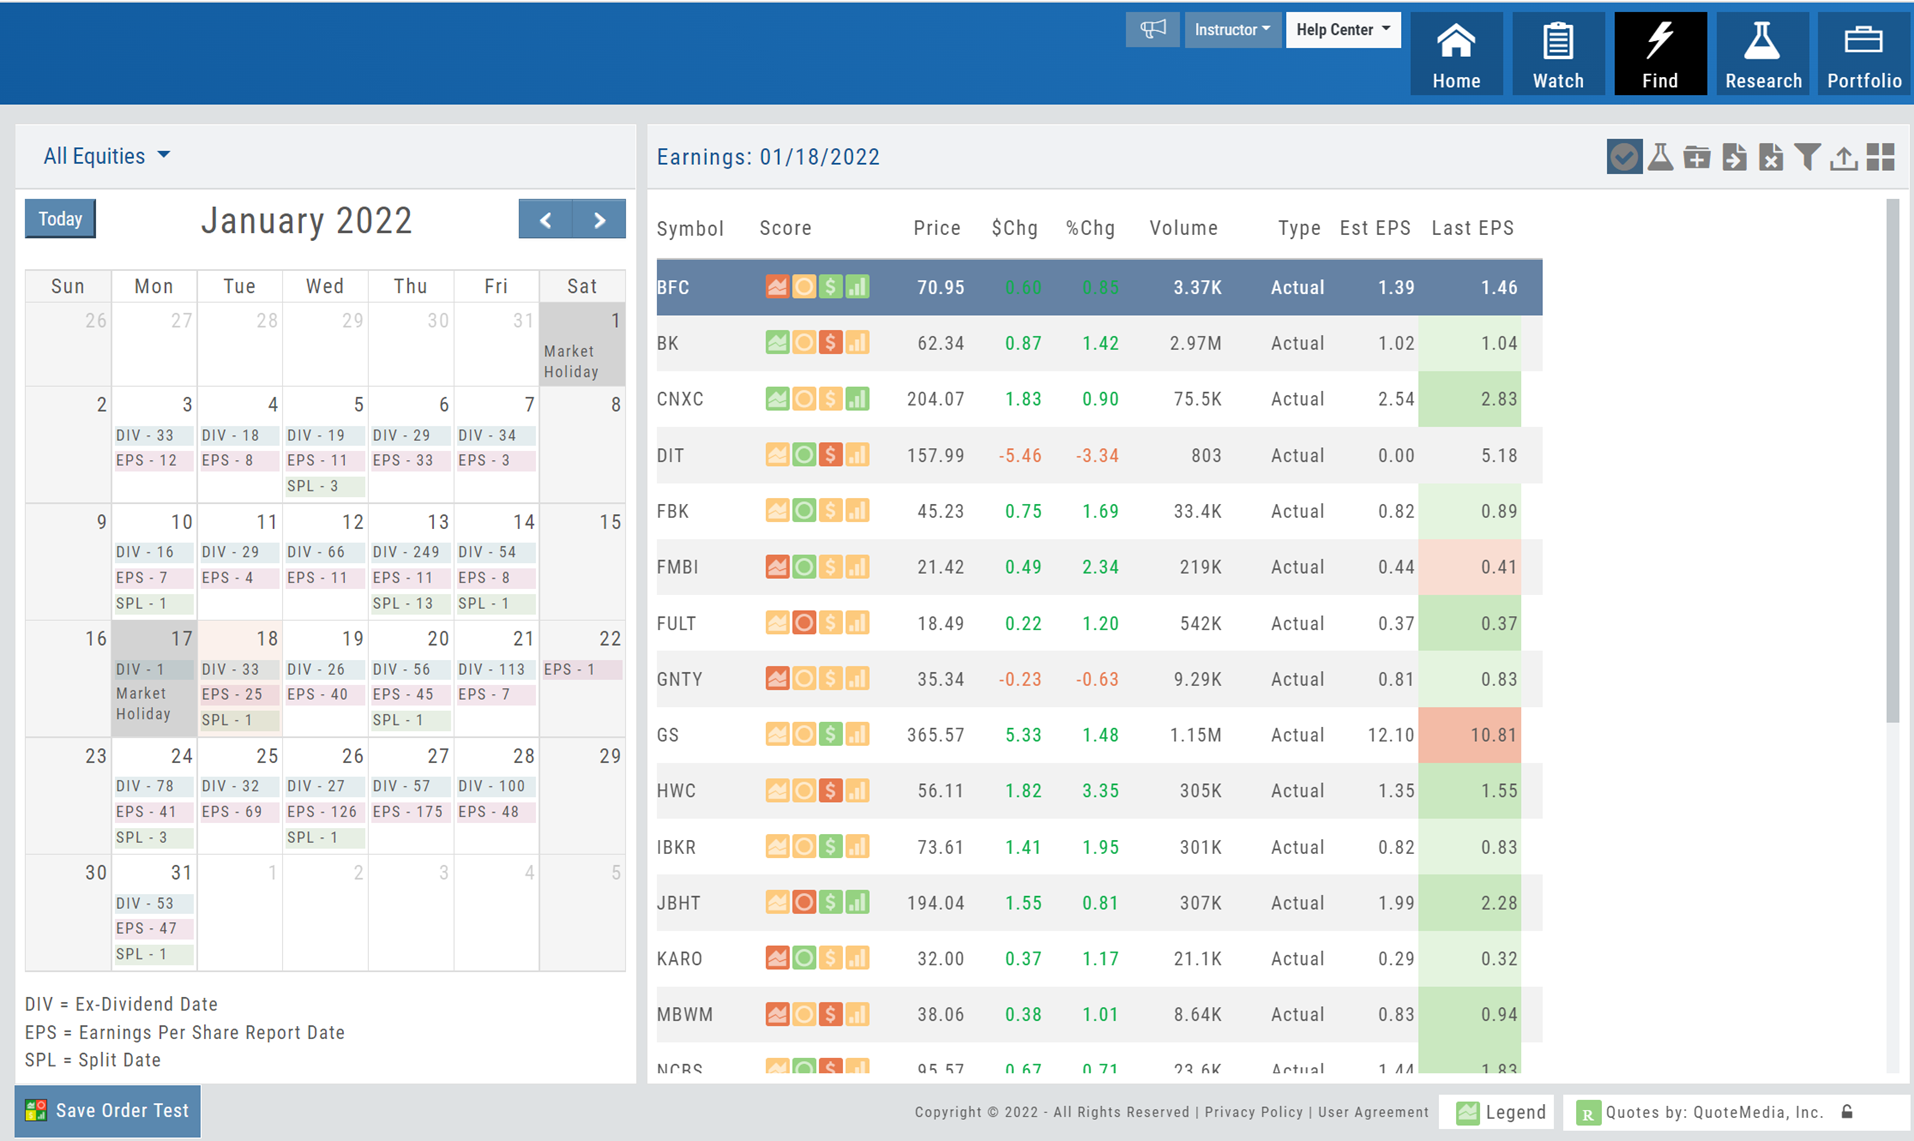
EPS = # of Companies announcing Earnings DIV = # of Companies announcing Dividends SPL = # of Companies announcing Splits Market Holidays also noted
This Navigational bar allows you to: Select Candidate (check mark) Download list, (Multi) Select, Send to Research, Add to Watch Lists. You can also Filter by Price, Volume, and criteria pertaining to Earnings/Dividends. All in List or Tile View.
Dark Green=Earnings beat Estimate >10% Light Green= Earnings beat Estimate Dark Red=Earnings >10% short of Estimate Light Red=Earnings