
Announcing the latest Release which added a powerful Lower Indicator on the Charts Tab: 52 Week Hi/Lo. Price/Date info has been added to X/Y axis
X/Y axis – Price/Date display
The cursor’s crosshairs will display the Price/Date info along the X/Y axis for easier reading.
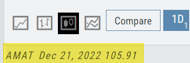
This information will still appear in the upper/right corner above the chart:
Drawing Key Activation
Use your keypad to activate drawing lines on the Chart by following these steps:
1. Click either in Header area above the chart – OR –
Click the Annotation icon>Line
2. Click on chart, then “Alt” and “T” keys where you want to start line.
Once activated from either of the starting points (1), the function works on the current chart, without having to reactivate by clicking on the Header or Annotation icon.