
The Chart tab
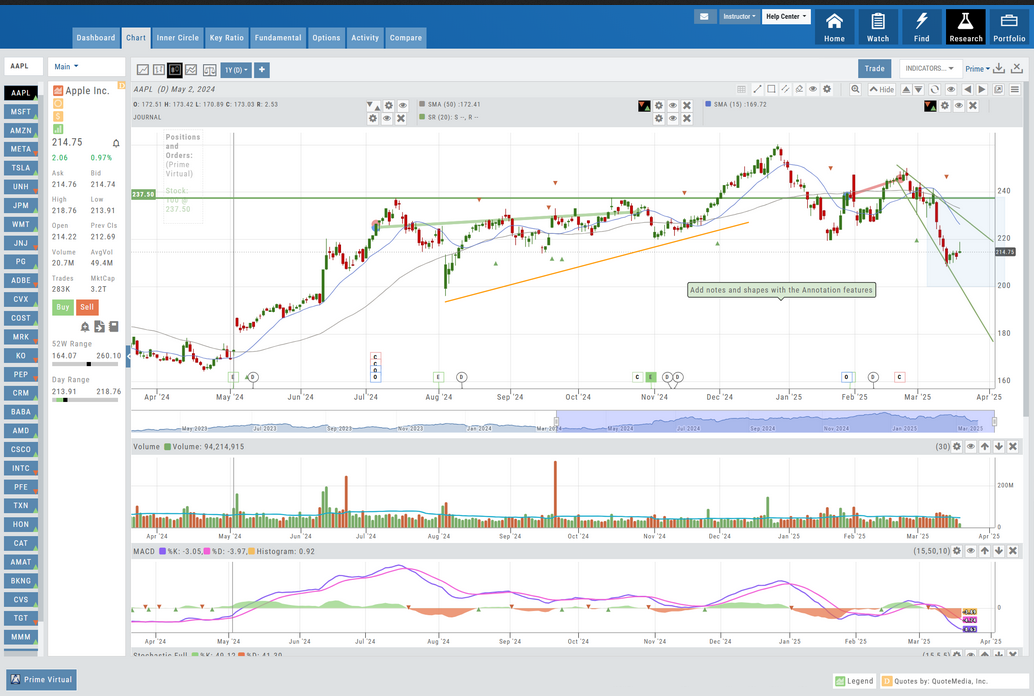
This displays the date and price information of cursor position on the chart.
You can save multiple profiles for easy access to your favorite views. Profiles remember chart type, indicators, indicator settings, period, and colors.
Click on the Annotation to adjust, color, position, etc. You can change colors between trend line drawn to highlight different trends with different colors.
Click icon to activate Annotations are automatically saved for future viewing Trend lines, text, circles and rectangles can all be added Colors and size defined in setting Erase some or all of your annotations
Over 30 Upper and Lower Indicators available
Read the full articleLine OHLC Candlestick Comparison
Read the full articleLines Circles Rectangles Text
Charts display working orders and existing positions directly on the chart. Stocks show a horizontal line at the cost basis. Options show a horizontal line at the strike price. You can change the indicator colors to your preferences.
Current Position on this symbol Solid Line - Active Trade Dashed Line - Order (not yet executed) Dotted Line - Staged Order
Identifies crossover points of two moving averages. Click to turn on/off.
Read the full articleThe Gear Icon controls settings on the chart: Candlestick color, Positon display, Tooltips, Grid lines, font size, etc.
Shown directly on the chart. "Circles" indicate an Option trade. "Squares" indicate a Stock trade. The trade is represented by a Green or Red line, indicating the trade was profitable or not.
Hover your cursor at the center, below the Navigation Bar to display an arrow. Click and drag tab to set height Note: This is remembered per device. The setting on your desktop can be different than on your notebook or tablet.
This icon is shown when an indicator\\\'s parameters can be adjusted. Displays the Setting, Definition/Description and the Defaults.
The tags - at the bottom of the chart- indicate when an trade is Opened [O] and Closed [C]. [N] indicates a Journal Notation was made.
Click the blue tab to collapse the Quote Bar and widen the chart. You can restore original chart width by clicking the tab again.
The shaded area corresponds to the chart period displayed. Slide one or both tabs of the bar to adjust the orientation period shown.
The brokerage tab is also where you can create/access a Virtual Account.
Advanced Indicators
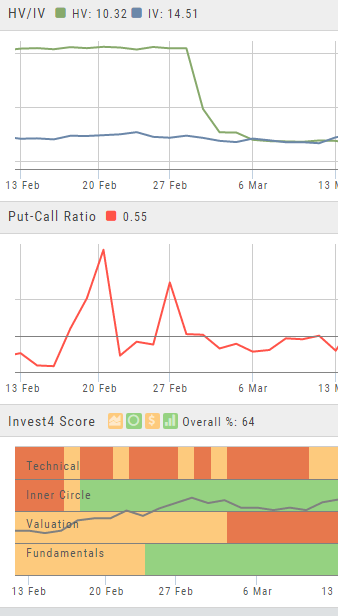
We offer select Advanced Upper and Lower Indicators that are not just derived from the price, including proprietary indicators like “Invest4Score” and “Insider Score”. They are accessible by using the “Add Indicator” drop-down box.
Upper Indicators include:
- Event Flags – showing Earnings and Dividends
- Journal Display
- Support/Resistance
- Extrema Trend Lines
Lower Indicators include:
- Historic Volatility/Implied Volatility
- Insider Score
- Institutional Percentage
- Invest4 Score
- Momentum Score
- Open Interest
- Options Volume
- Put Call Ratios
Chart Types
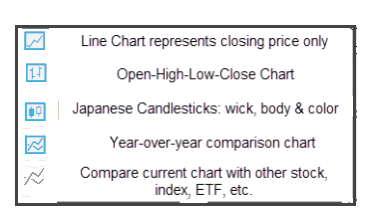
Lines, Bars, Candles & Comparisons
You have the flexibility in not only the way the data is displayed, but you also have choices in comparisons: Year-over-Year comparisons of your current Stock, up to a 5-year period. You can also compare your current stock to another stock, another index, ETF, etc.
Crossover Arrows
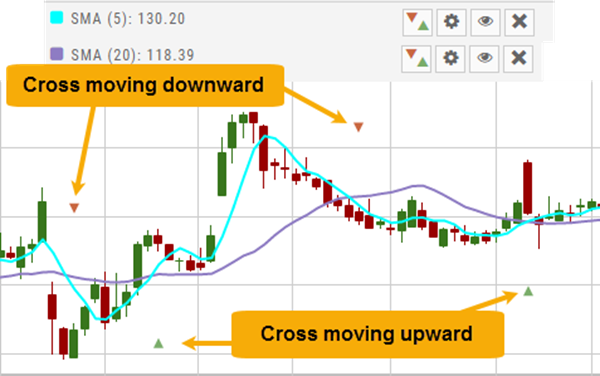
The Crossover Arrows  identify the crossover points on indicators.
For upper indicators, you can select 2 indicators and the chart will show the crossover arrow.
Example: If you select the 5 day and 20 day SMA the Green arrows will show the 5/20 crossover points when in an upward movement, Red for downward.
Only 2 moving averages can be selected at a time when utilizing this tool. If you wish to make a change to another moving average indicator, one must first be deselected before adding the new indicator.
Trade from the Chart
The chart is also a trading surface: place orders from it, watch working orders on it, and see pre/post-market activity on intraday views.
The  button appears at the top of the chart for any symbol – whether there is an existing position or not.
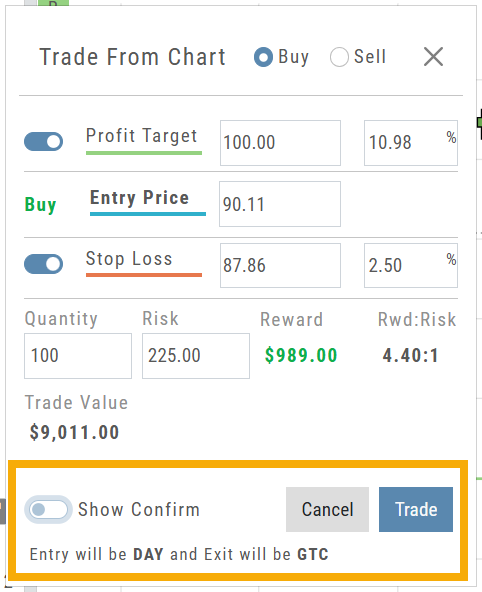
Clicking this button activates an Order Window on the Chart, like this:
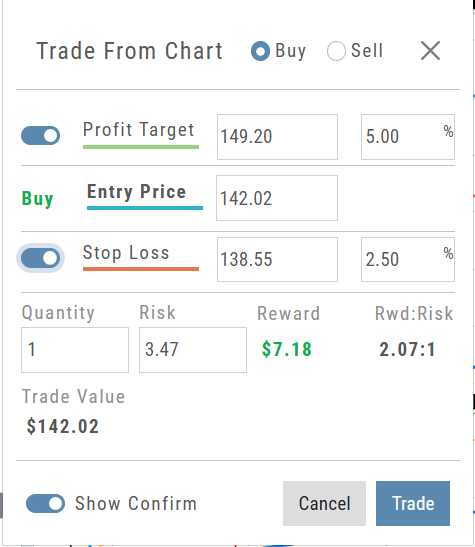
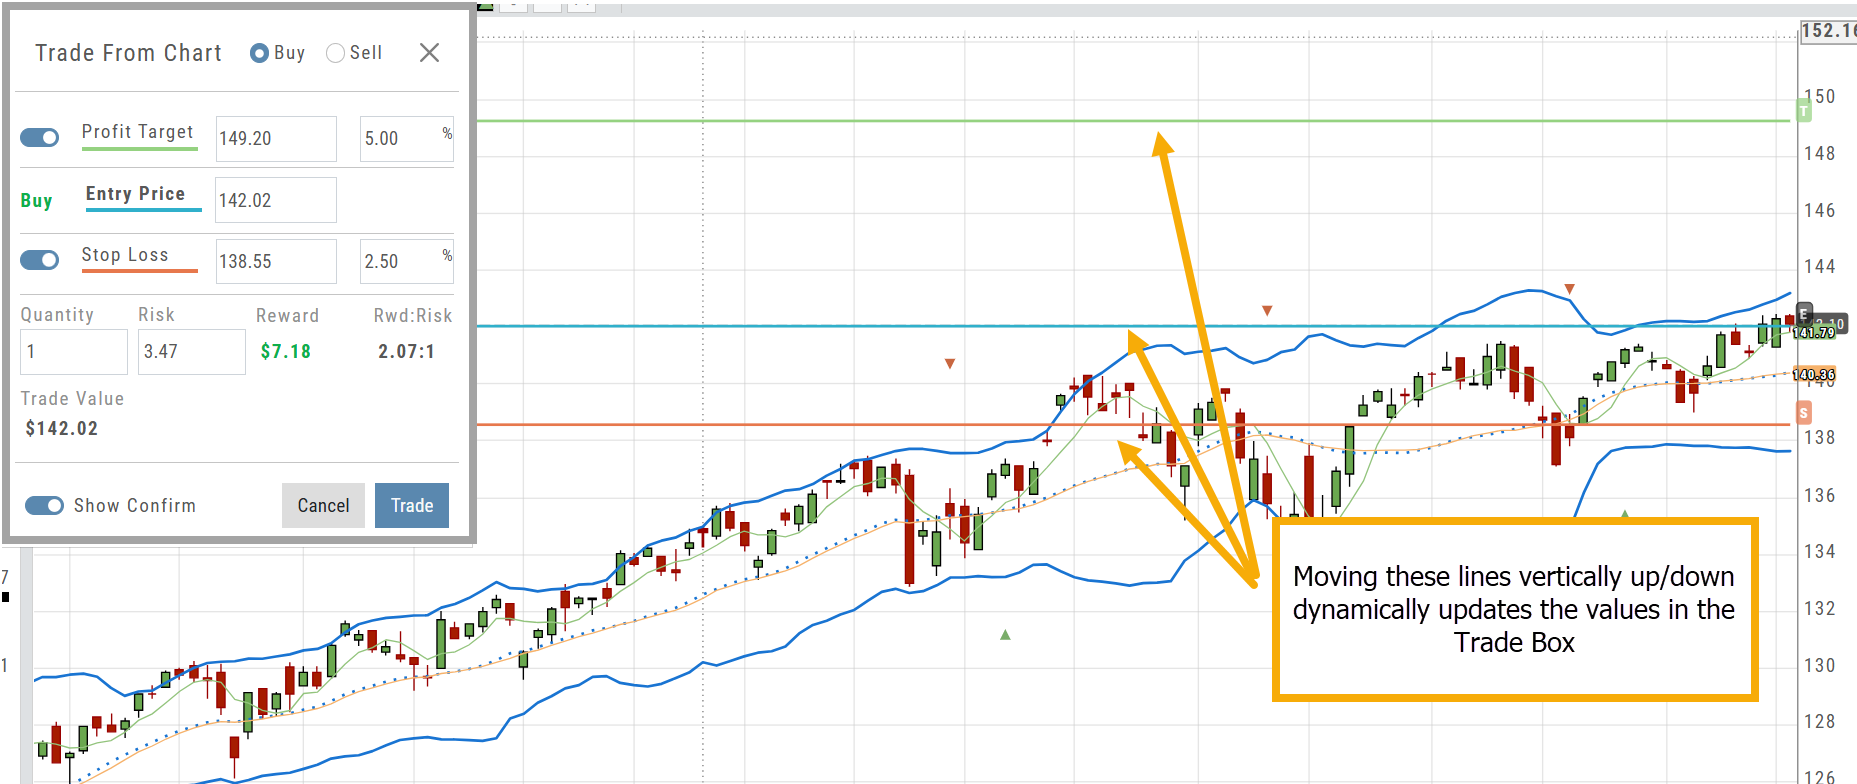
Note: Buy, Profit and Stop Loss line colors will match those displayed on the chart itself.
The values in the Order Window can be manually adjusted by $ or %
The values can also be dynamically adjusted by moving the corresponding line(s) on the Chart itself.
The Quantity value default is “1” to show the ‘per share’ dollar and percentage estimated risk, reward, as well as Position Total.
Show Order Status (Go to Order Ticket)
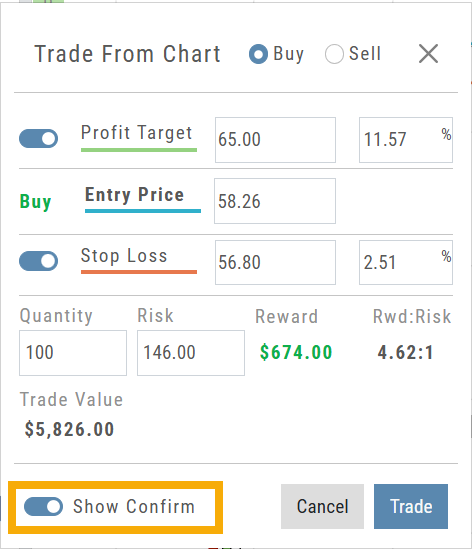
When trading from the Chart (OCO orders), you can elect to Show Confirmation – or not.
Toggling “On” will take you to the Order Ticket to review and submit your Order to the supporting brokerage.
Additional edits and staging the order are enabled with this selection.
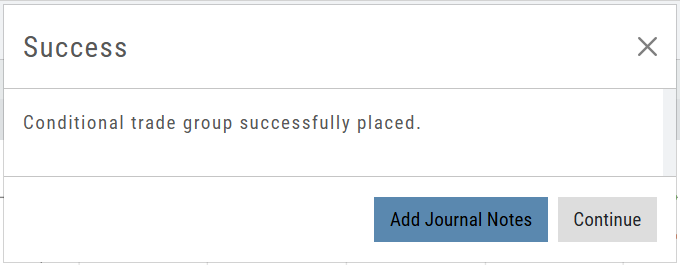
Once reviewed and submitted, you’ll get a confirmation that the order was submitted, as shown here:
Toggling “Show Confirm” to Off, will bypass the Order Ticket window and convert the “Trade from the Charts” action to an Order Ticket itself.
Notice: The Entry is a Day Order, the Exit is a GTC order
Clicking “Submit” will send the order directly to the supporting brokerage.
Since the “Order Ticket” is bypassed, this order cannot be further edited or Staged.
Once submitted, as with “Show Confirm” activated, you’ll see this notice:
Lower Indicators
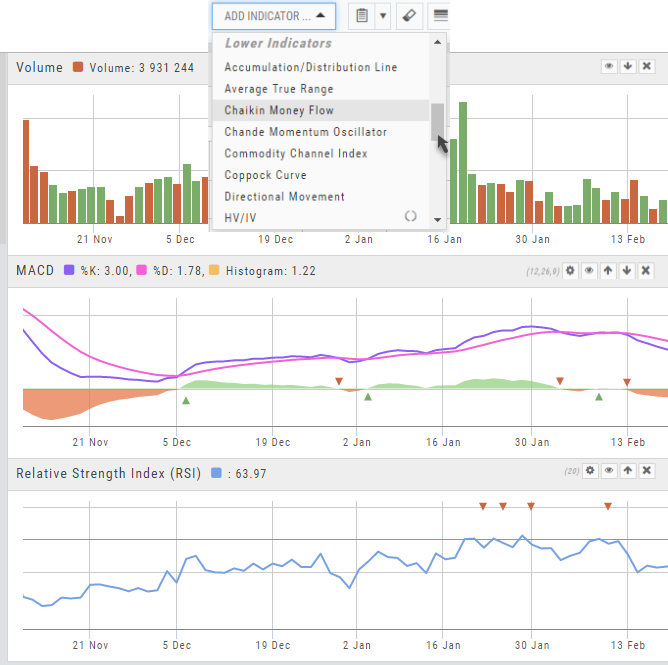
The “Add Indicator” drop-down box has a section of Lower Indicators you can add below the main chart.
Many of the Indicators allow you to customize the parameters prior to adding.
Once the Indicators are in place, the icon tool bar – found on the upper right above each graph- gives you the ability to edit (Gear), hide (Eye), move up/down (Arrows) or delete (X) to truly customize your view.

Mobile — Charts
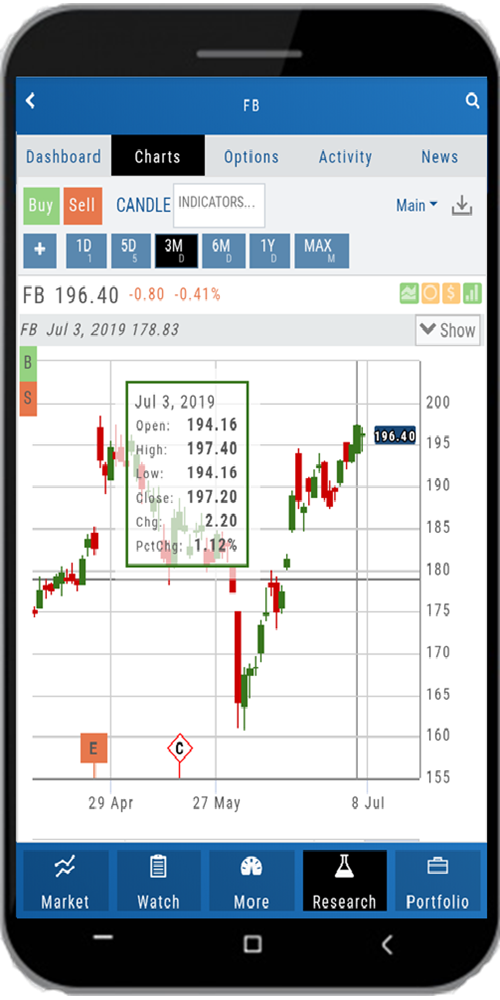
Add Upper/Lower Indicators. Tap 'Save' icon to save settings by overwriting existing profile or naming a new one.