
The Research Dashboard
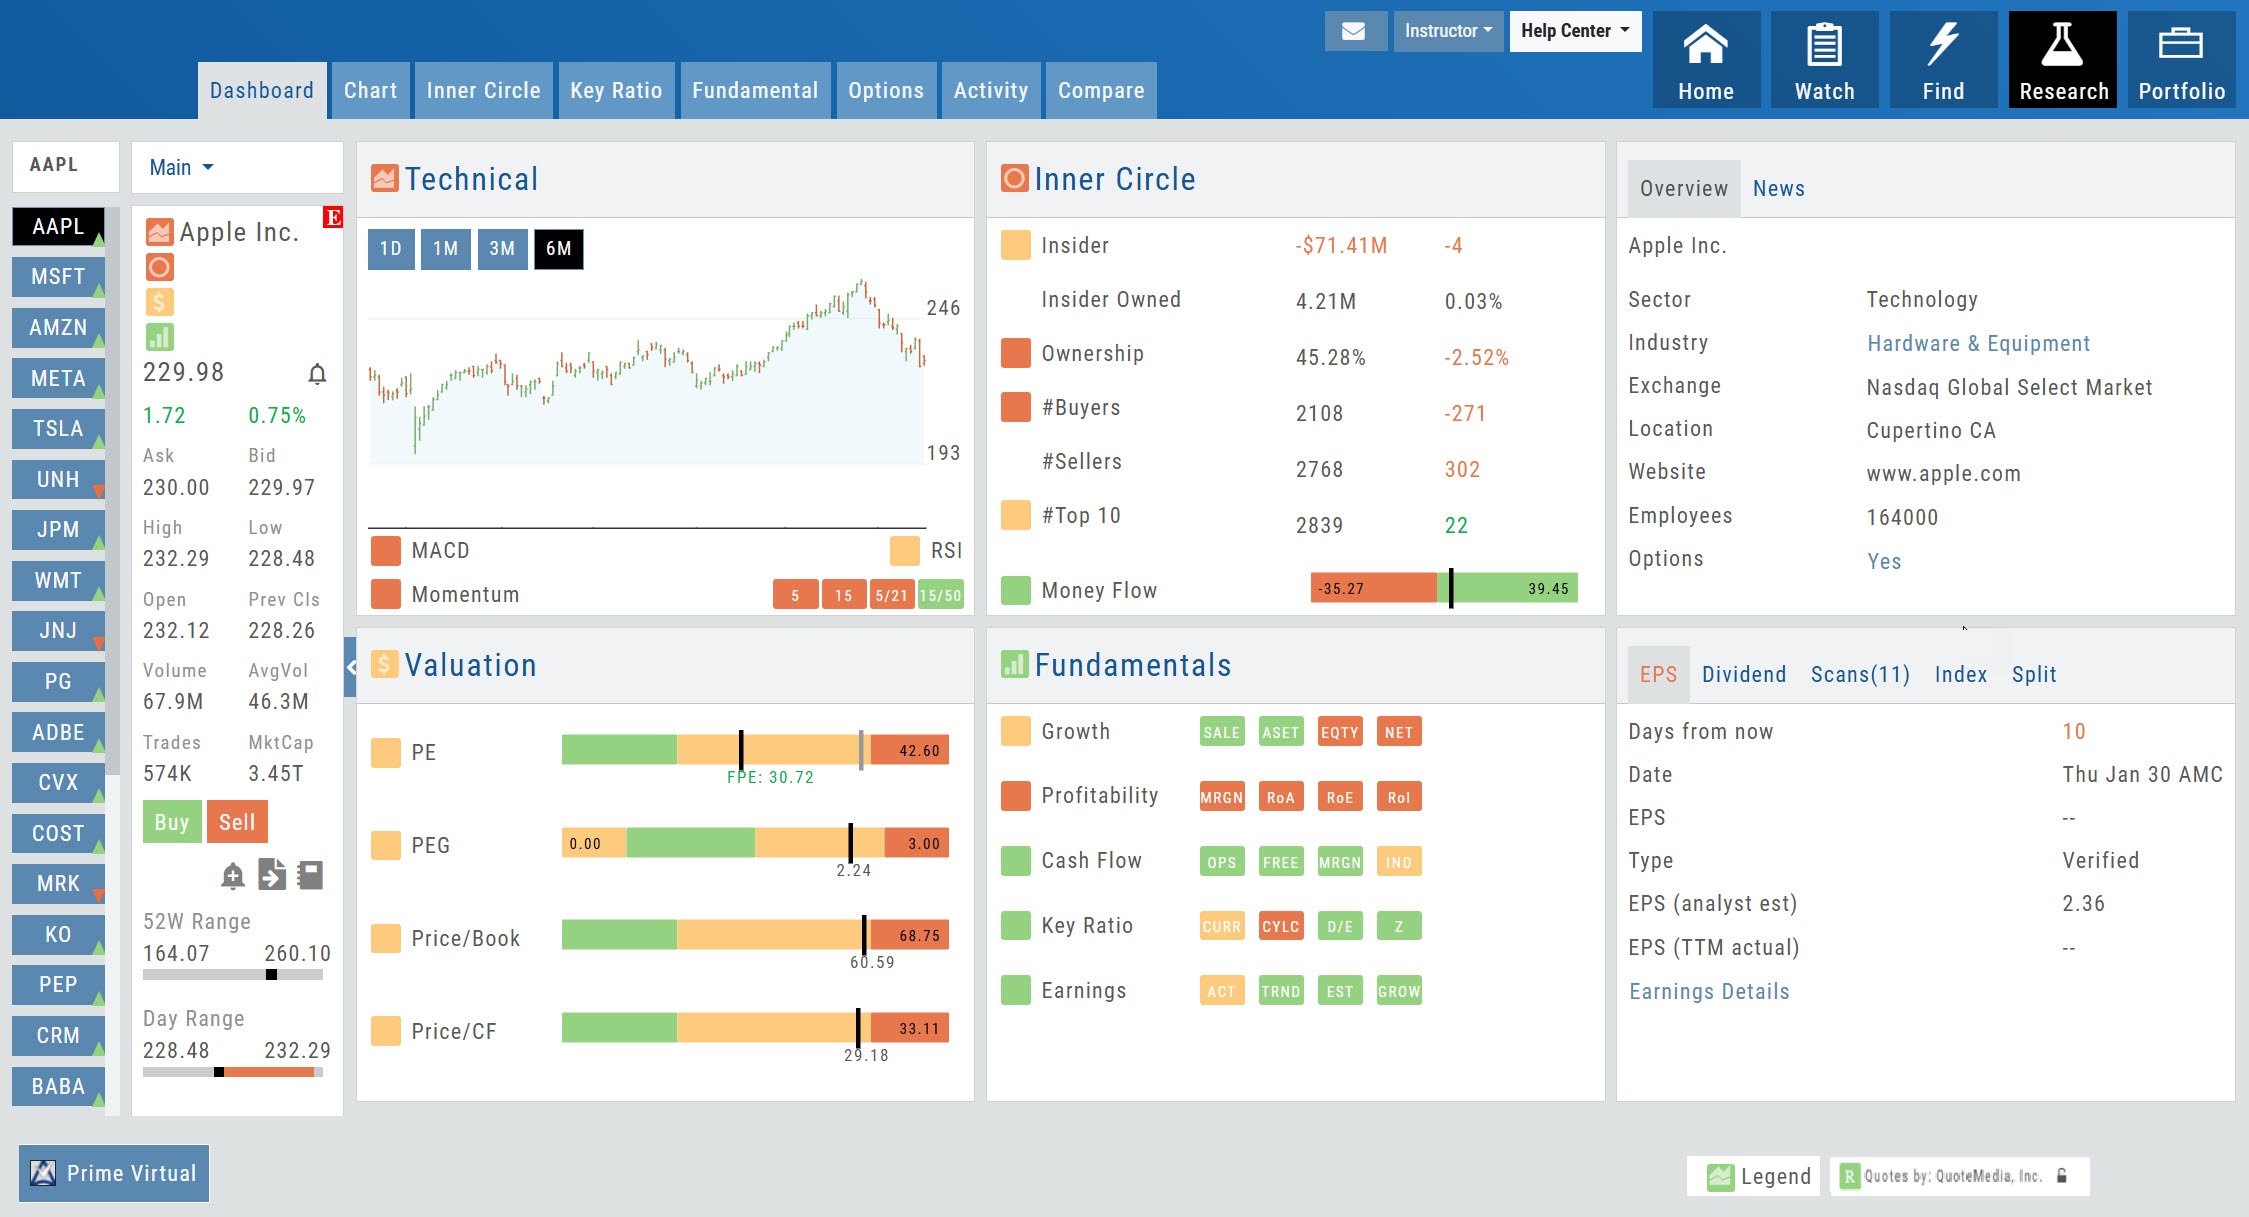
Resources on the Platform: Quick Guide, User Guide, Video Library Create a Support Ticket
Create an Alert Send to a Watchlist Add a Note
Symbol Search box. Add symbol (if known) to add. If not known, type in name of company, then select Symbol.
Current "Score" Click any of the Icons to go to that section of Research
Score Icon is also a Navigational tool. Click to go to that section of Research.
Earnings Information Dividend - Includes Ex-Date & Payout Date Scans - List of Scans this symbol can be found in Index - List of Indices this symbol can be found in Split - Date, Info & History
Activated Trading Account. Click to view/change to a different account
Shows up in RED if Earnings Announcement is in 10 days or less
Inner Circle
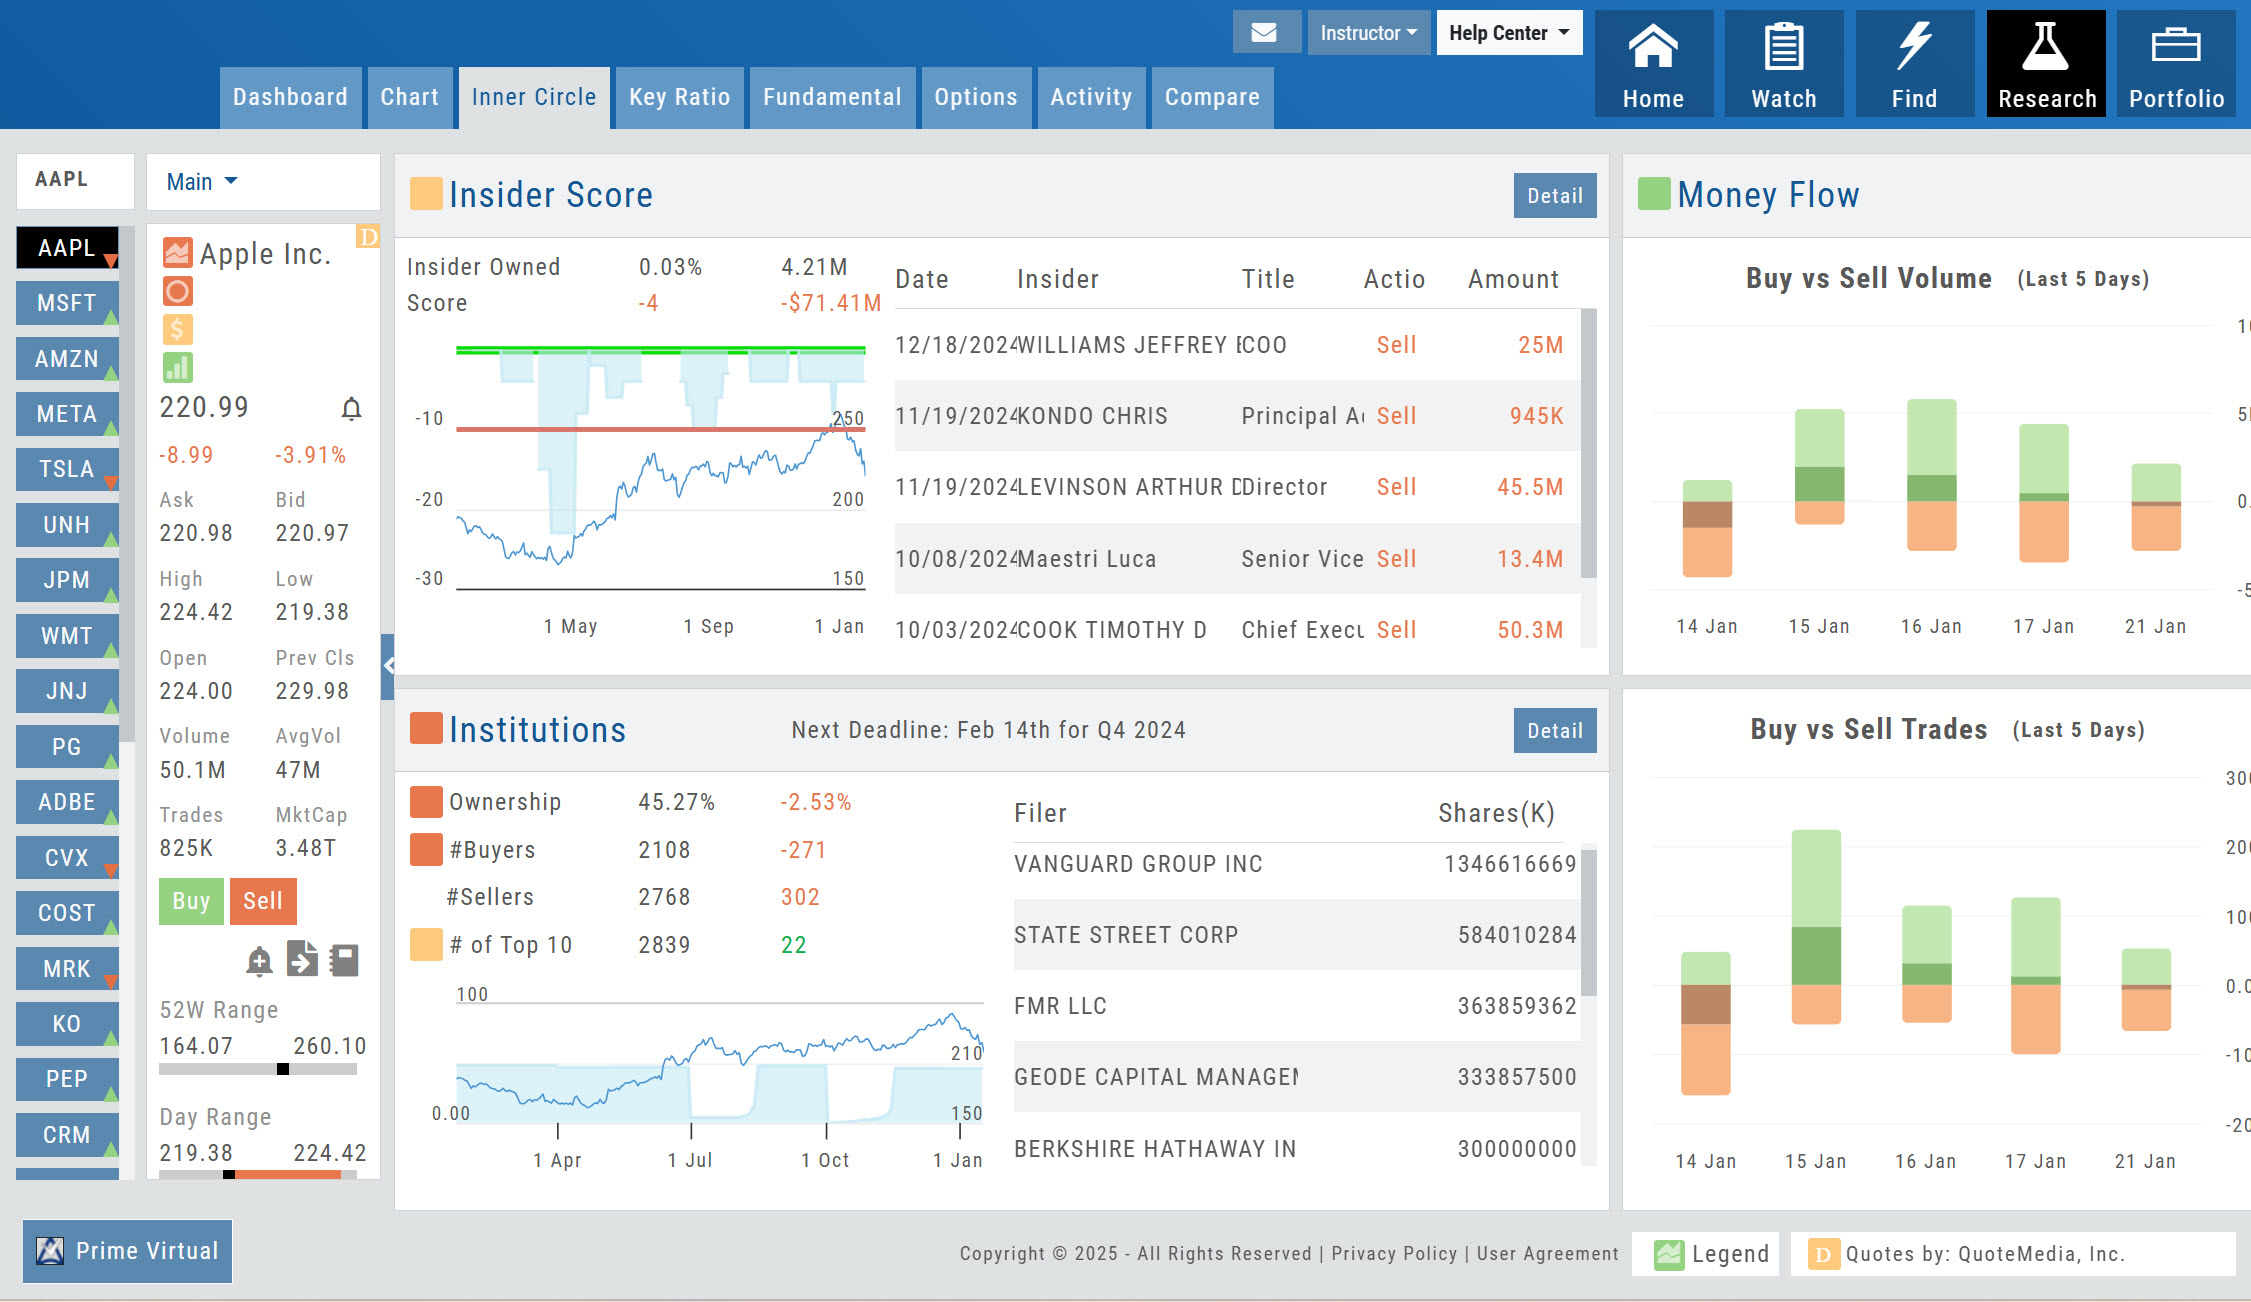
Shows trading activity by amount. The darker shade in the middle (either dark green or red) indicates difference between the buy volume and sell volume. Where the volume and trade overlap differs on the same day is an indication \\\\\\\'big money\\\\\\\' (Institutions) moving in/out of stock.
Provides a baseline to determine this part of The Score A Positive Score indicates net buyers. A score between 0 (zero) and -10 will yield a Yellow Score, as some insider selling is normal and expected. A Red Score indicates heavier selling outside of a normal, expected range. Note: The level of insiders are also weighed. Example: Buying/selling activity by C-level Officers, Board of Directors, et
Click to access more in-depth detail from the Insider page of the Research Tab
Click to access in-depth detail from Institutions page of Research Tab
Note: The sharp drops occurring near the end of a Quarter reflects a common practice to improve appearance of a Company\\\\\\\'s performance, known as "Window Dressing"
Shows increase/decrease in number of Buyers/Sellers compared to previous Quarter. While the number shown for increase in Sellers is Red, it is actually a Positive indication (fewer sellers).
Click "Detail" to be sent to Insider page on the Research Tab.
Click "Detail" for more in-depth analysis. Note: Deadline at top of this tile for reporting. Institutions must report filings Quarterly.
Updated Quarterly, with the percent change (+/-) from the previous Quarter In this example, Institutional ownership has decreased 4.75% from the previous Quarter.
Shows trading activity by number of trades. The darker shade in the middle (either dark green or red) indicates difference between the buy and sell activity. Where the volume and trade overlap differs on the same day is an indication \\\\\\\'big money\\\\\\\' (Institutions) moving in/out of stock.
Net dollar amount traded last Quarter also shown.
The total number of institutions that have this stock in the top 10 of their portfolio. The number change over last Quarter. Green for increase Red for decrease
Key Ratio
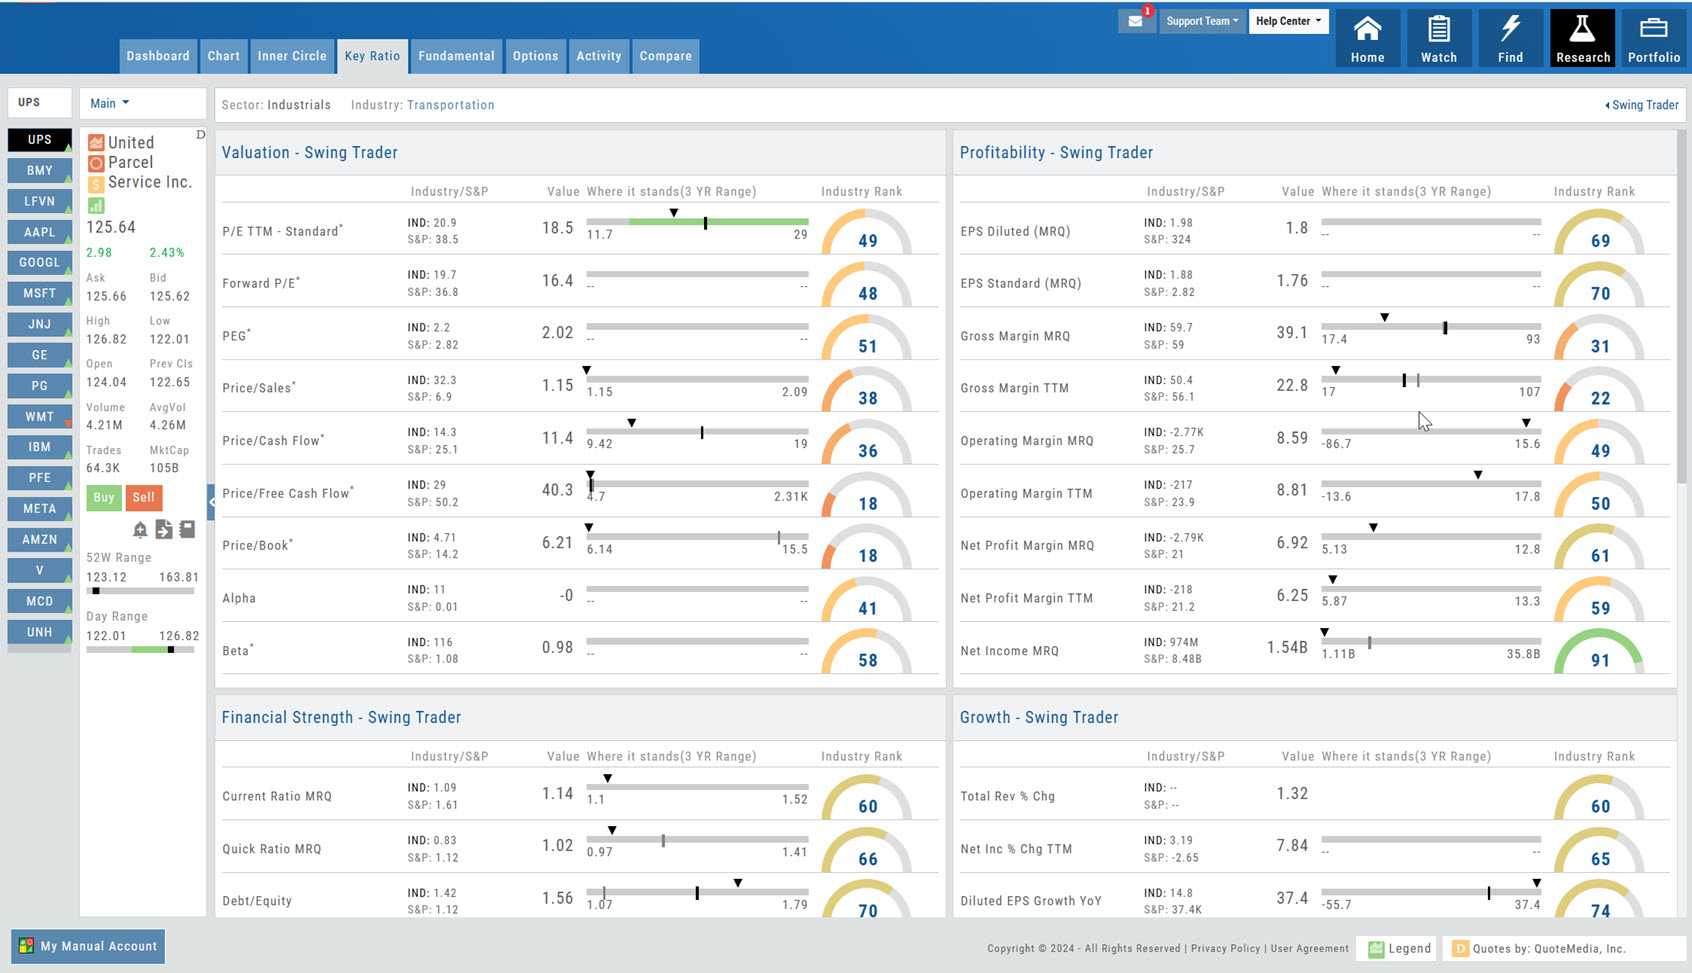
Current company status Hatch mark - The Industry Average
Select view for information pertaining to short-term, intermediate and long-term trading.
Fundamentals
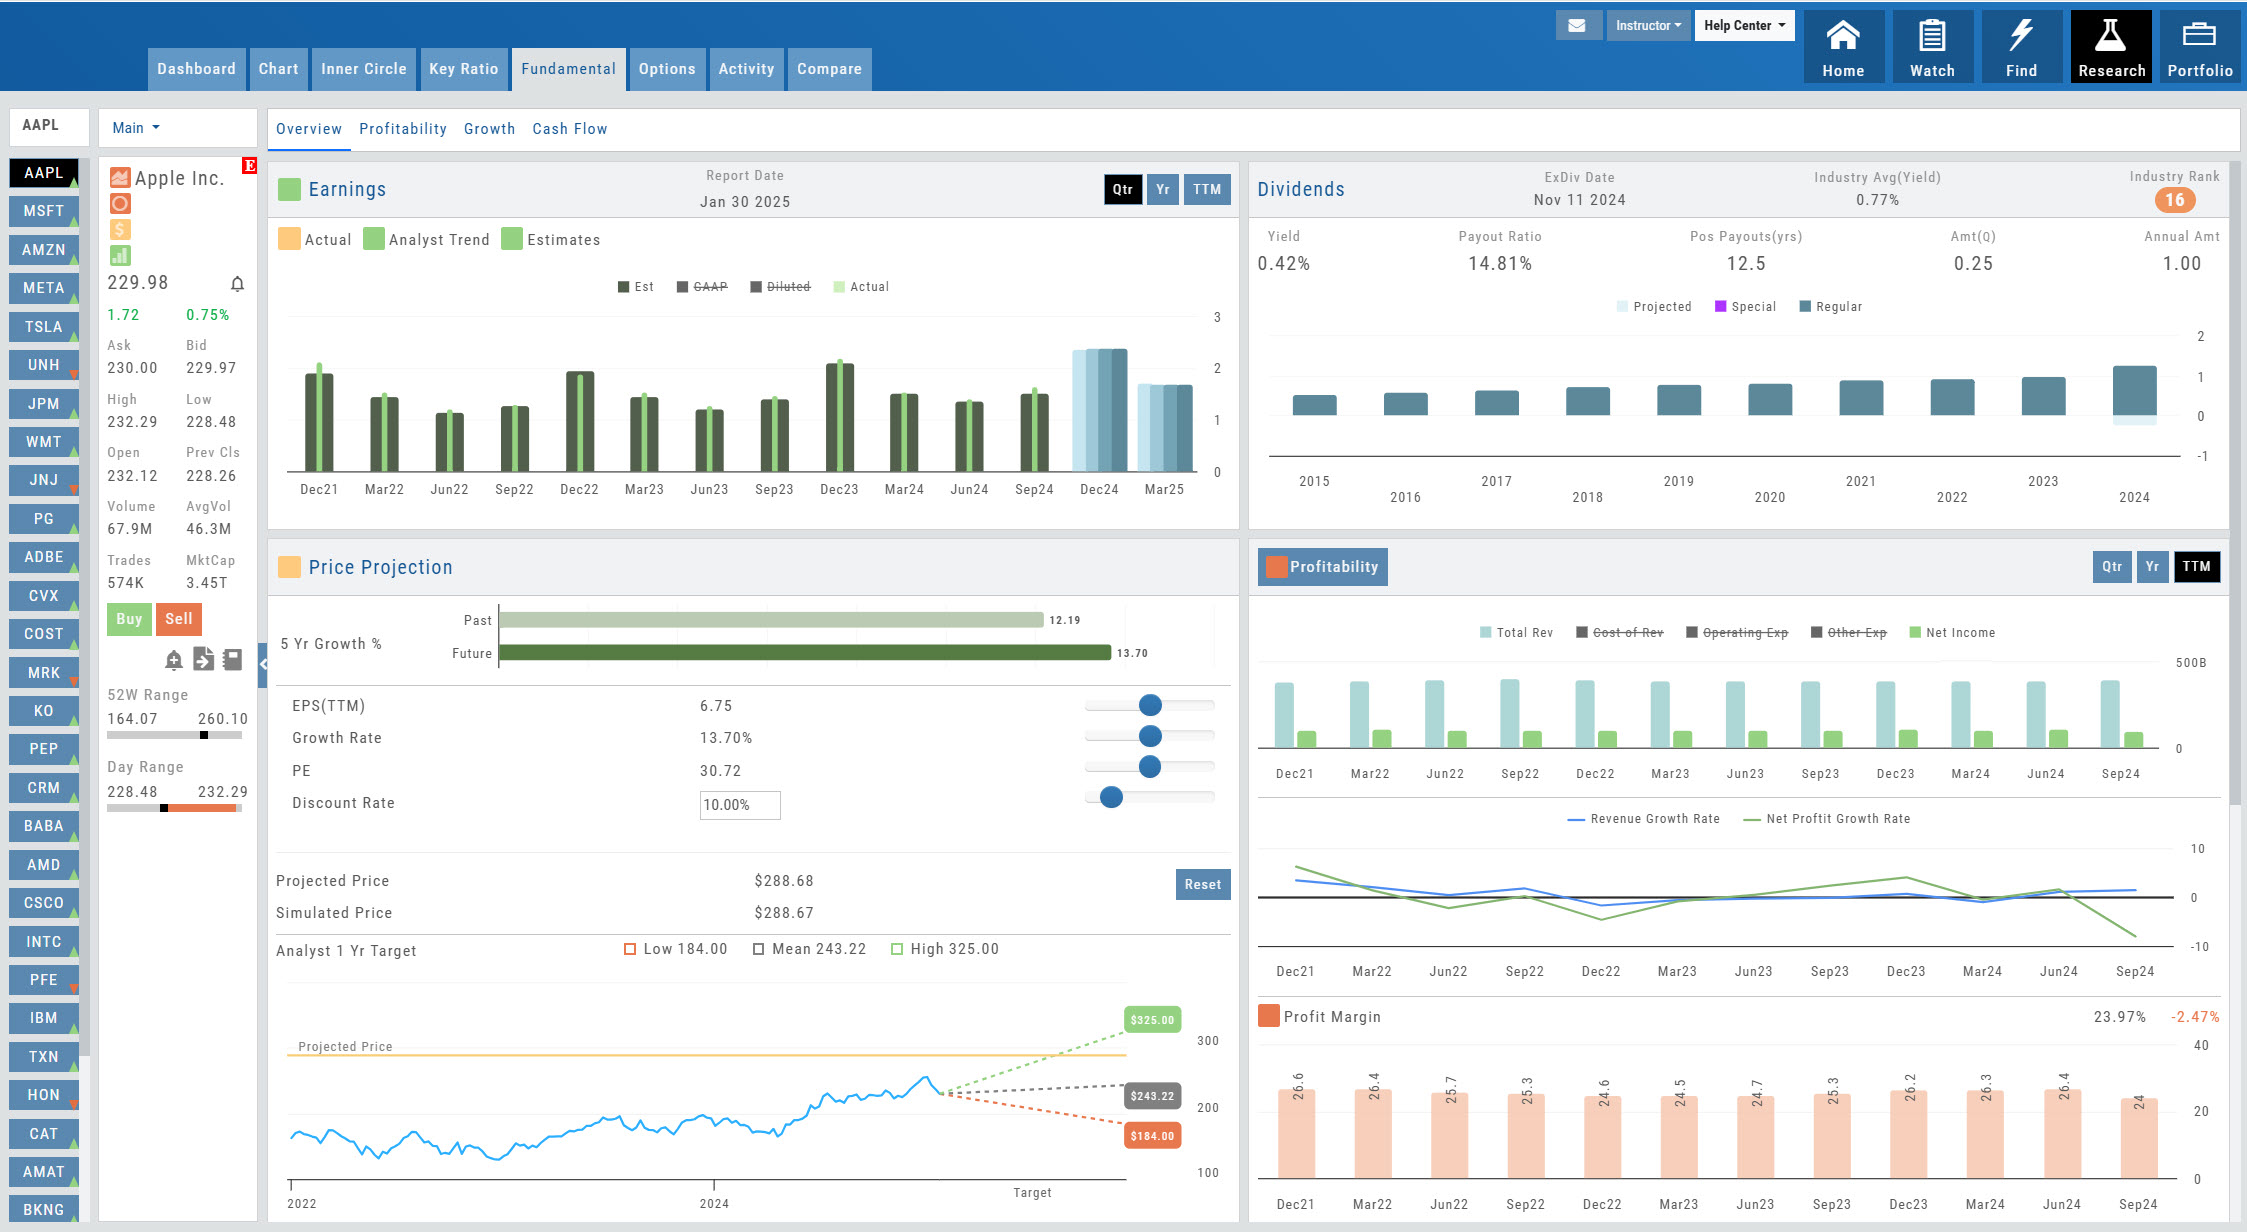
Rank comparison for similar companies. The higher #, the better
Adjusts values in this section to see results as "Simulated Price" Ex: "What if Growth increases?"
TTM- Trailing 12 months Year- Calendar Year Qtr- 3 month period
Scroll for more. Check out the Key Ratios & Fundamentals video in the Help Center Video Library
To get dividend, one must own stock prior to Ex-Div Date .
vs. Net Income Toggle items to data in bar chart
Toggle to view Revenue vs. Net Profit during last three years. View as Qtr, Yr, or TTM
Activity
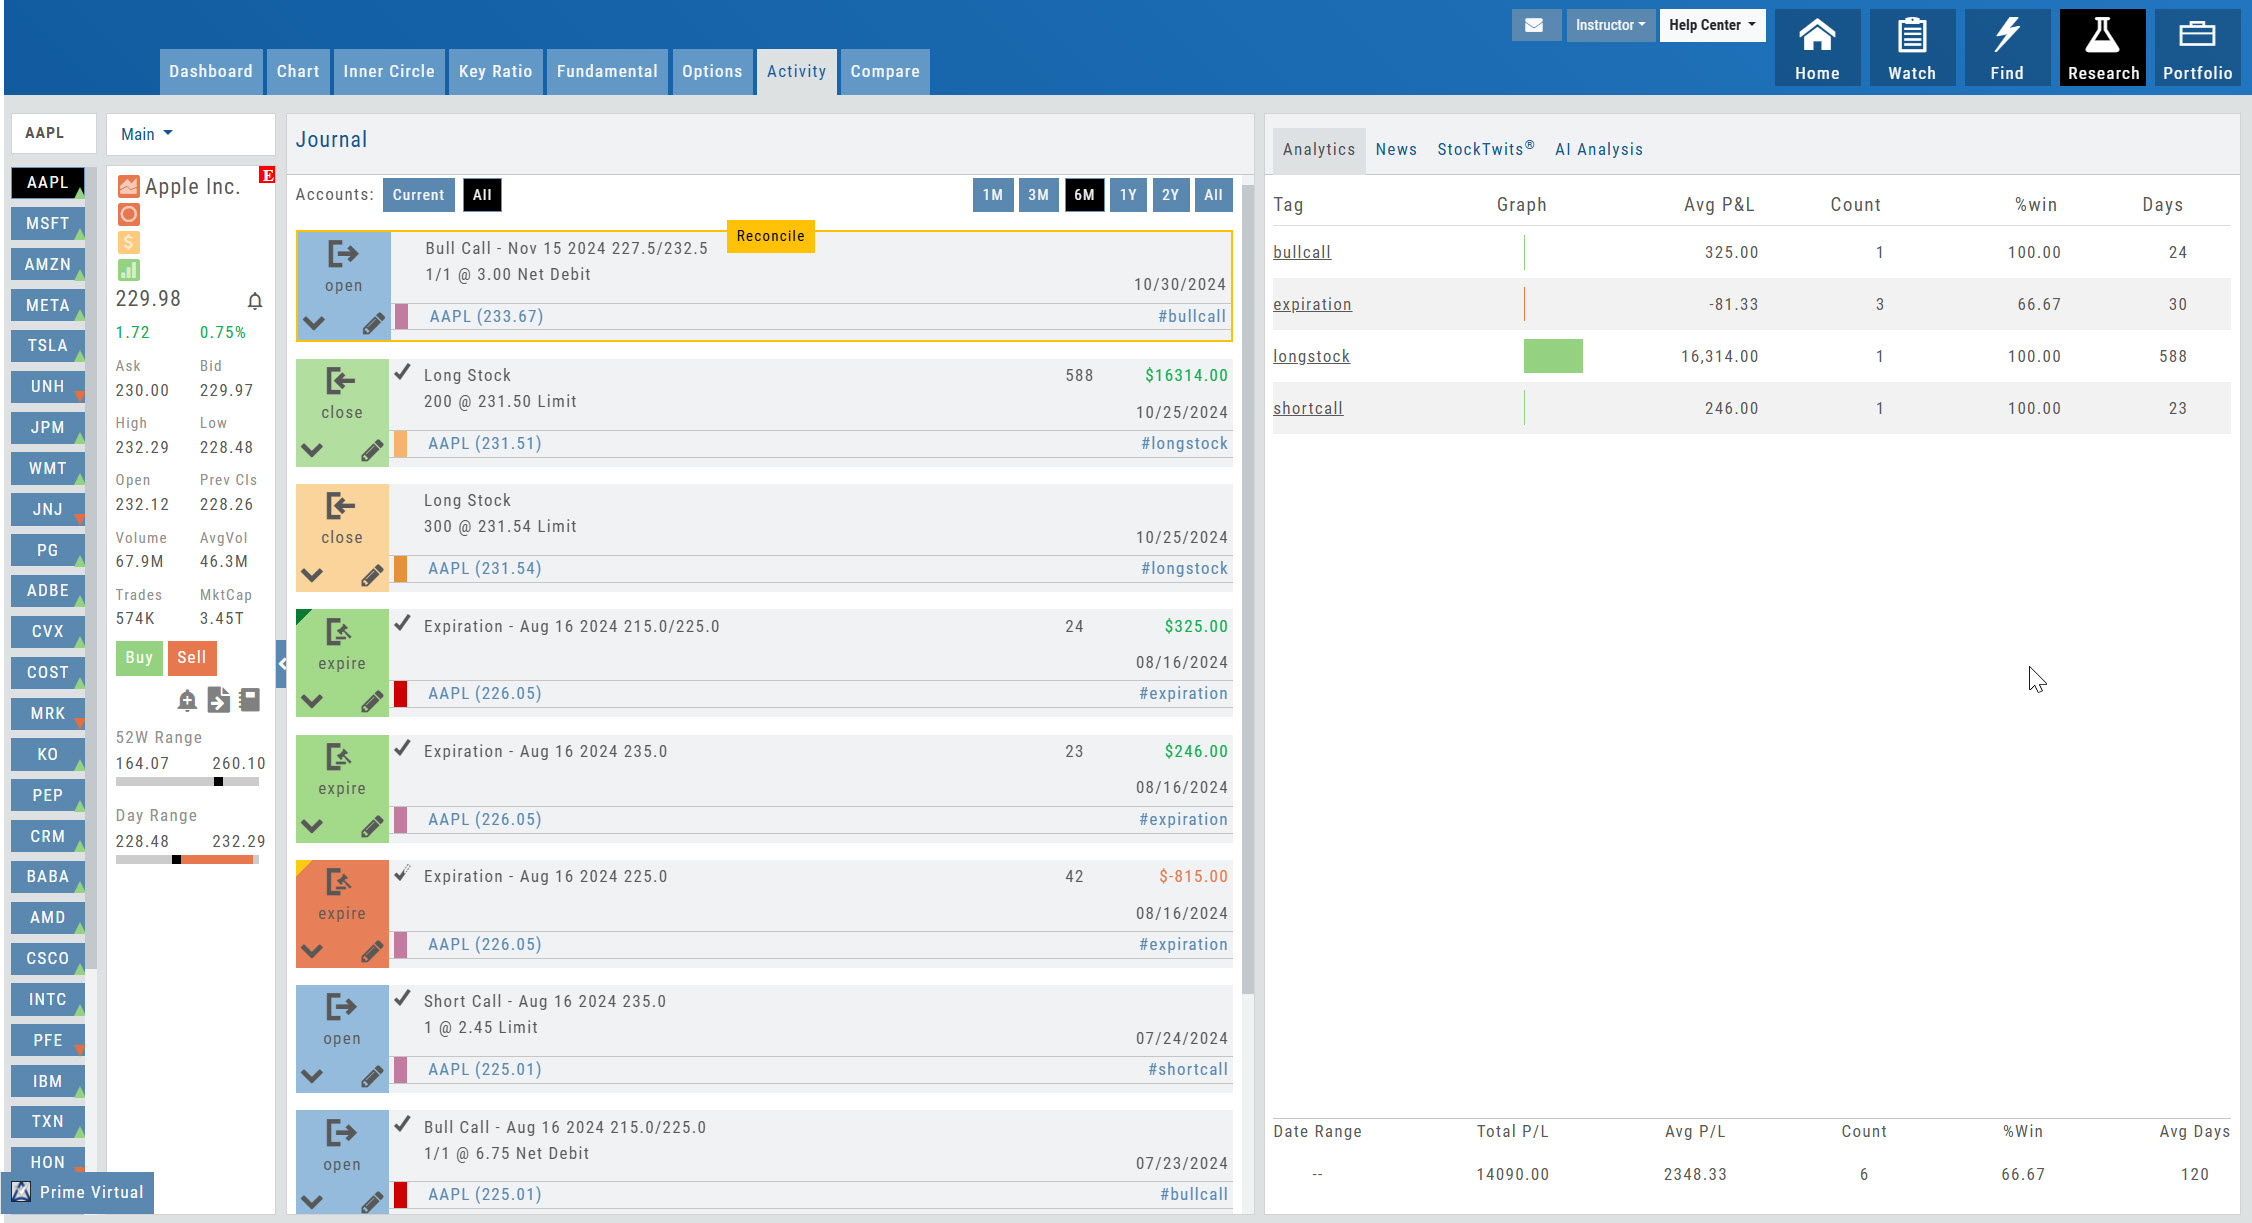
View the current account tab (bottom left corner), OR select ALL accounts (Manual, Virtual and Live) for activity on this symbol.
Yellow tabs are unmatched to Open/Adjusted activity. Click Edit/Pencil icon to view possible matches. Color Codes of Trade Tabs
Shows strategy, average profit (loss), frequency used, percentage winning , how many days in trade.
Get real time sentiment and gauge insight from real investors and traders on the stock
Confirm activity after going through Expiration Reconcile Trade Notice
Institutions detail
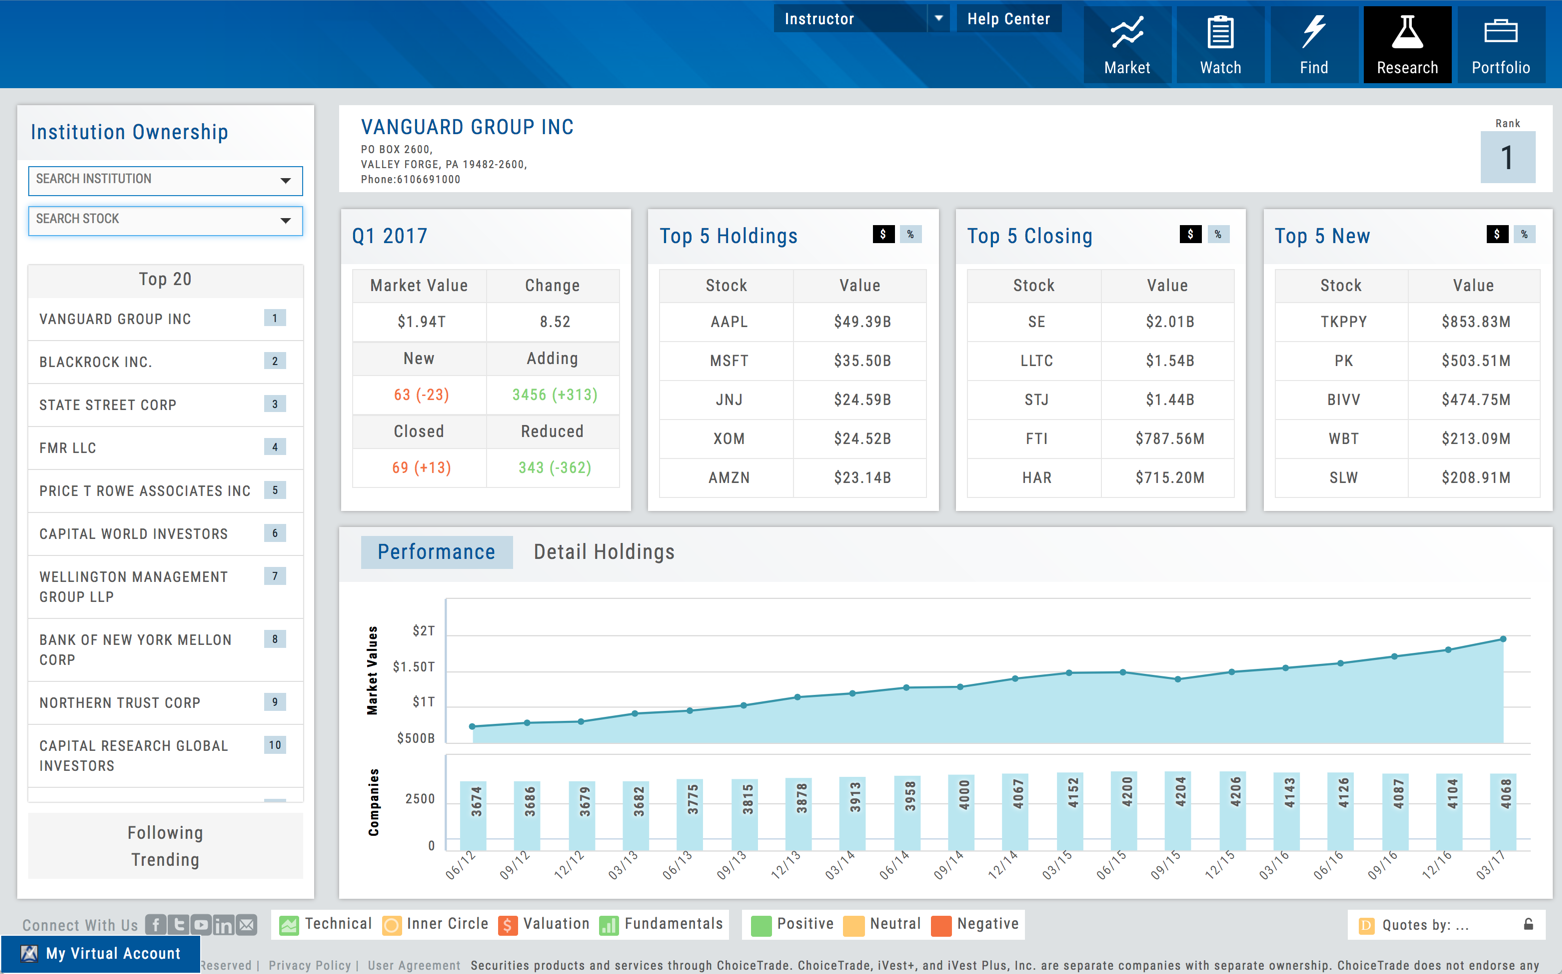
Start typing in the name of an Institution or a Stock in the appropriate box. Smart Search will auto-fill matches to help you locate candidates to research. When searching by Institutions, the result will list the Top 5 Stocks held by $ value and as a percentage of it's Portfolio, among much more information. Searching by Stock will list the Institutions holding that stock, the $ value and percent
Get latest Quarter summary info, Top 5 stock additions, deletions and holdings.
Updated Quarterly
Evaluate an Institution's performance by the ability to view how assets have increased over the last 20 Quarters. This detail also provides the number of companies the Institution is invested in and corresponding Market Value. Hover your cursor over graph points to get Market Value at the end of each Quarter
Shows Market Value of Stock held ($) and Percentage the stock makes up of the Institution's Portfolio (%)
Top Institutional Ownership by Market Value reported from the latest available Quarter report. Click on any of the candidates for a more in-depth look of where the institutional money is, where it was moved from, etc.
Click on the arrow next to each symbol for more in-depth analysis on that stock.
Insiders detail
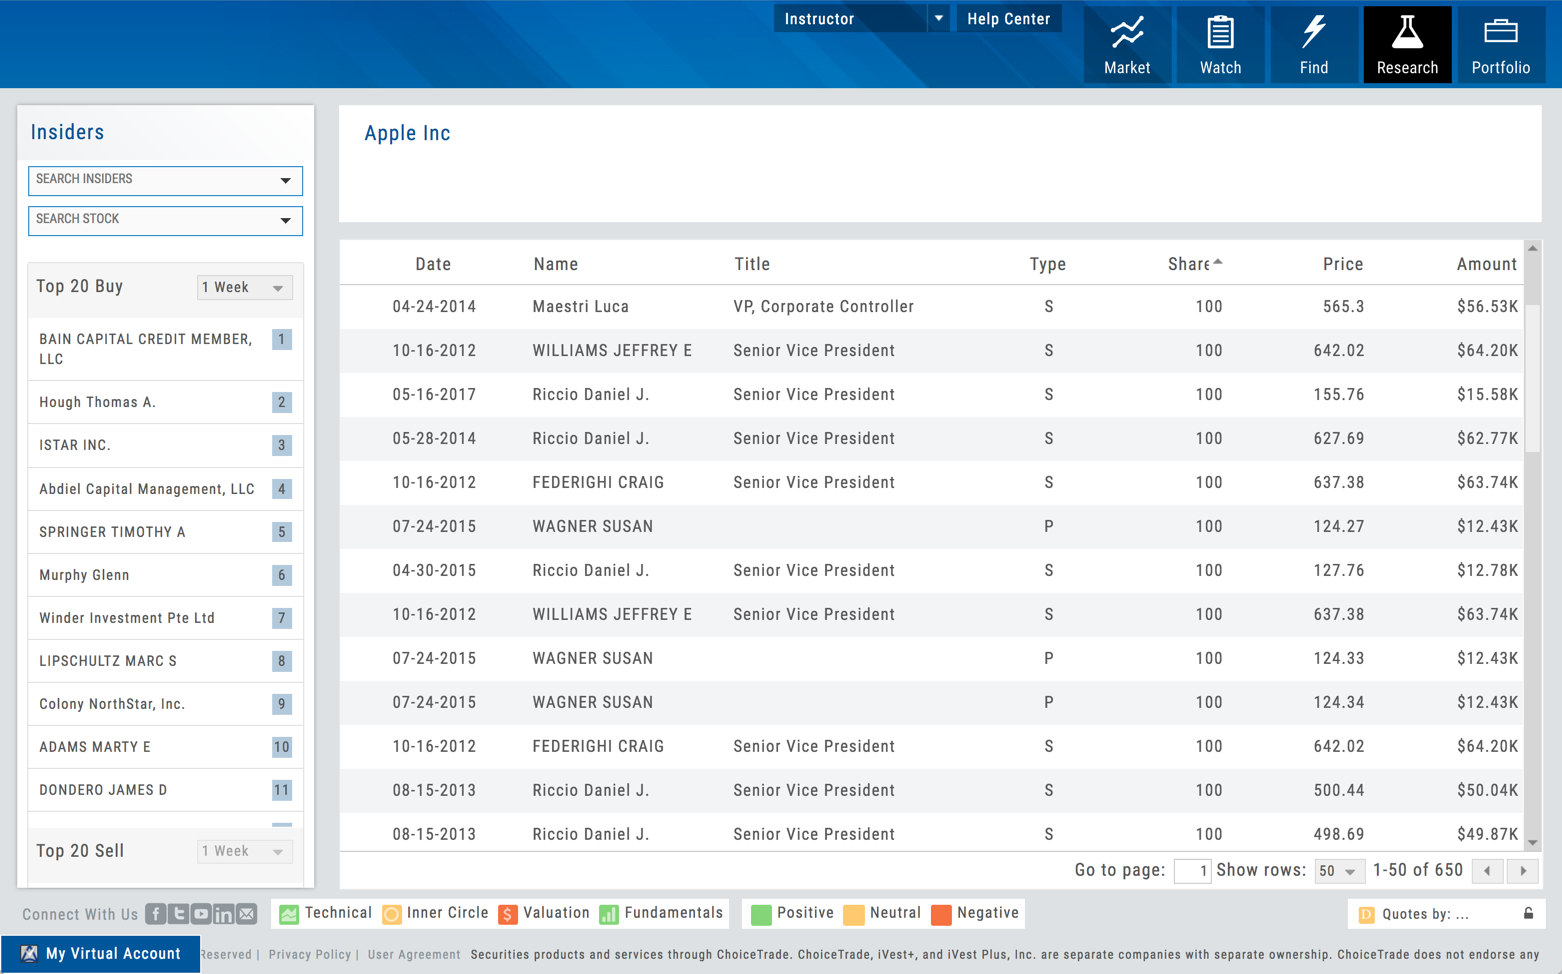
Heading categories can be sorted by clicking next to the category name.
Start typing name of Insider, Group or Stock Symbol or Company Name in the appropriate boxes. Smart Search will list potential matches. Searching by stock lists the insiders who own that stock. Searching Insiders will list the stocks owned by that Individual or Group. stock.
List of top buyers by Market Value in the selected time frame.
General Transaction Codes P - Open market or private purchase of non-derivative or derivative security S - Open market or private sale of non-derivative or derivative security V - Transaction voluntarily reported earlier than required
Mobile — Research Dashboard
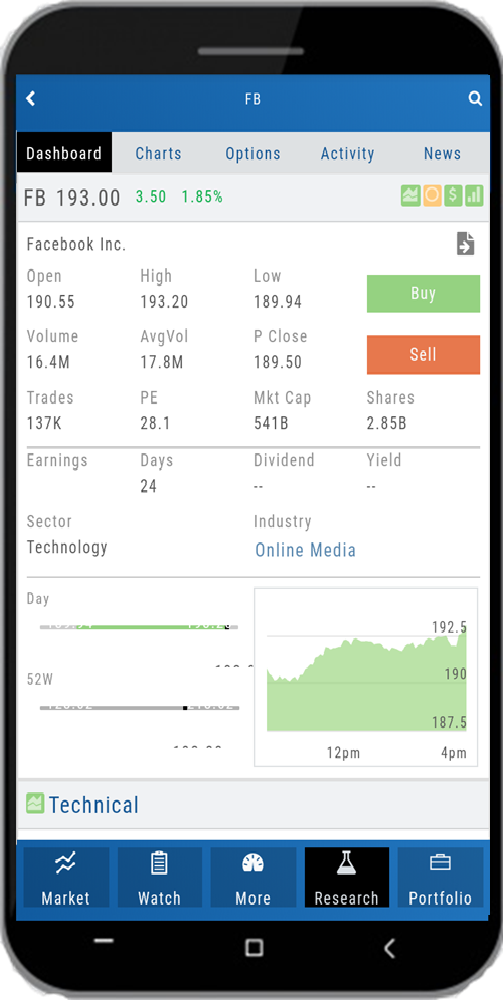
Mobile — Fundamentals
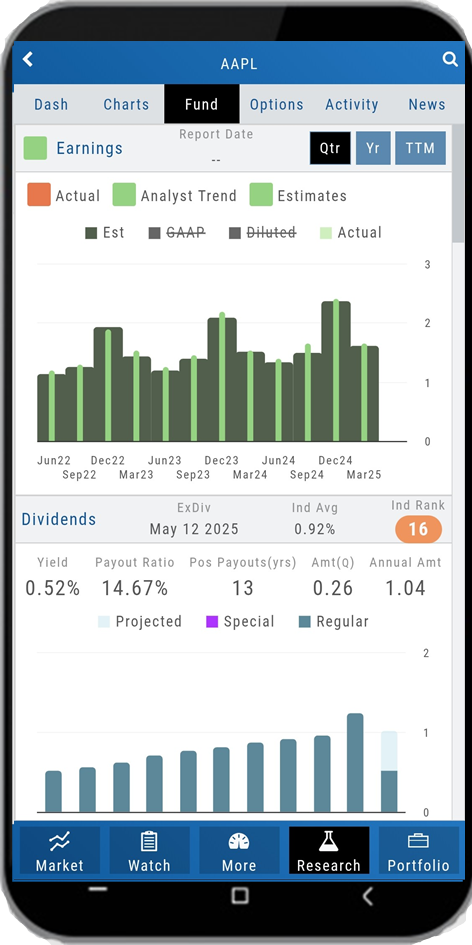
For more information on Fundamentals, Go to the top-specific video in the Help Center\\\'s Video Library