
Draft for review. The article content in this guide is migrated and unchanged. The introduction and the short lead-in paragraph at the top of each section are newly written and are marked “New text — pending review” — nothing in them has been approved yet.
One symbol, every angle: the Research Dashboard pulls the Score, technicals, valuation, fundamentals and insider activity into one place. This guide walks the tabs in the order most people use them.
You can read straight through, or use the contents list to jump to what you need. Every section below is also a standalone article — the “Open as article” link under each one takes you to it on its own page, if you want to bookmark or share just that piece.
The Research Dashboard
New text — pending review
The dashboard in one pass: the Score, the panels, overview and news, earnings and dividends, the price change indicator, and the AI analysis tab.
Research
Narrow the field to find the highest probability trades.
Stock
You’ve narrowed the field by selecting potential candidates matching the outlook and selected strategy, but which of those have the highest probability of success? Research allows you to drill down for information as much or as little as you want.
The Dashboard provides an overview: Quote Detail, The Score, Activity such as News/Earnings/Dividends and information about the Company and a list of other company stock symbols in the same industry. Each component has its own tab to provide more detail.
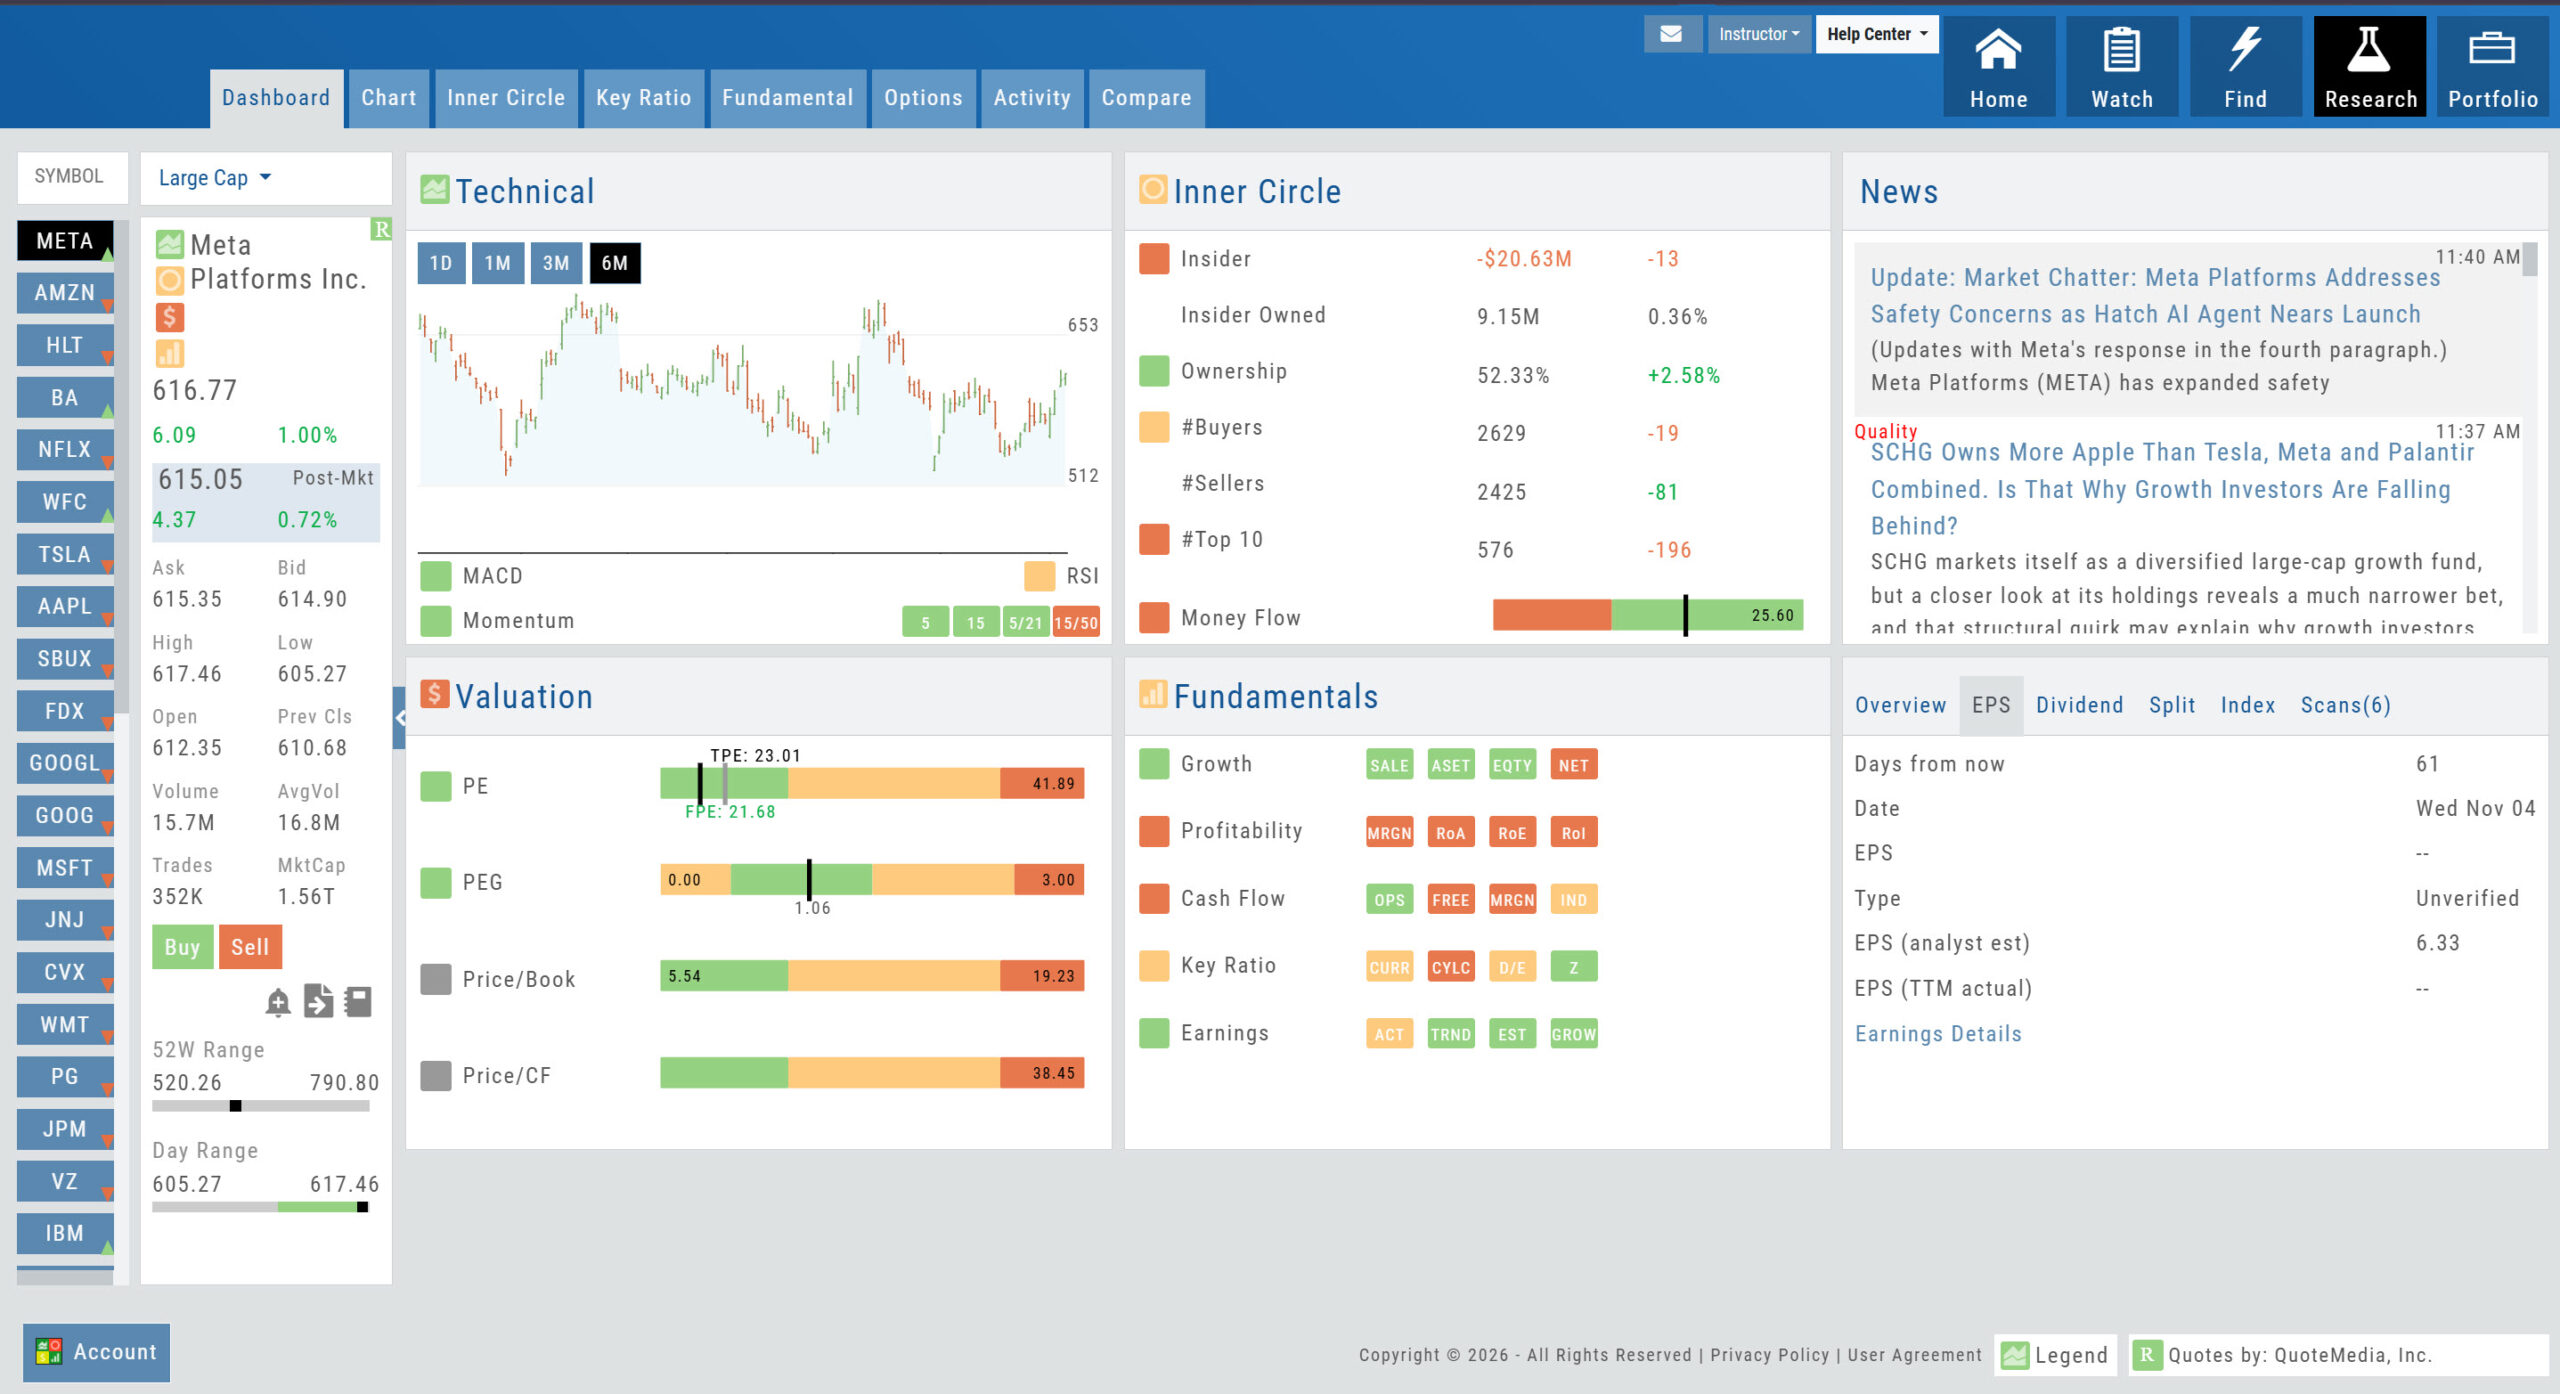
Components of The Score are designed to keep the information available to you, but out of the way when you don’t need it.
The Options Tab offers Strategy templates, option chains, snapshots and definitions of strategies, P/L Graph with Risk/Reward ratio, Analytics and Stock/Volatility charts.
The Activity Tab includes a Beta version of the Journal as well as News and StockTwits ®
The Power of “The Score”
Our Proprietary Scoring System: Technical Analysis, Inner Circle, Valuation, and Fundamentals.

Designed with your workflow in mind and to give you the level of information you want, while keeping it out of the way when you don’t.
The order of The Score is based on the speed at which the stock is affected: Technicals being the fastest, and Fundamentals the slowest. For example, a very short term trader may not put as much weight on Fundamentals as with the Chart. However, as an actively managing investor, Fundamentals will be more influential on your trades.
Overview & News
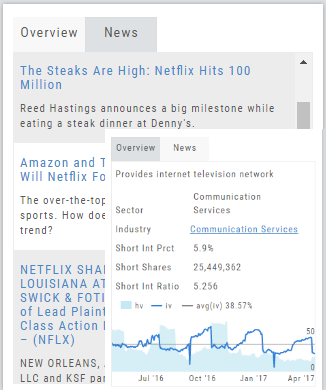
Located in ‘The Dashboard’, the Overview provides a snapshot of the company, including the Sector and Industry. By clicking on the Industry link, a list of stock symbols in the same category will appear. The “Stock Detail” list will have current market information and The Score navigational icons.
The News section lists articles covering, related to, or mentioning the selected Company. Click on any headline to be linked to the full article.
Earnings, Dividends and more…
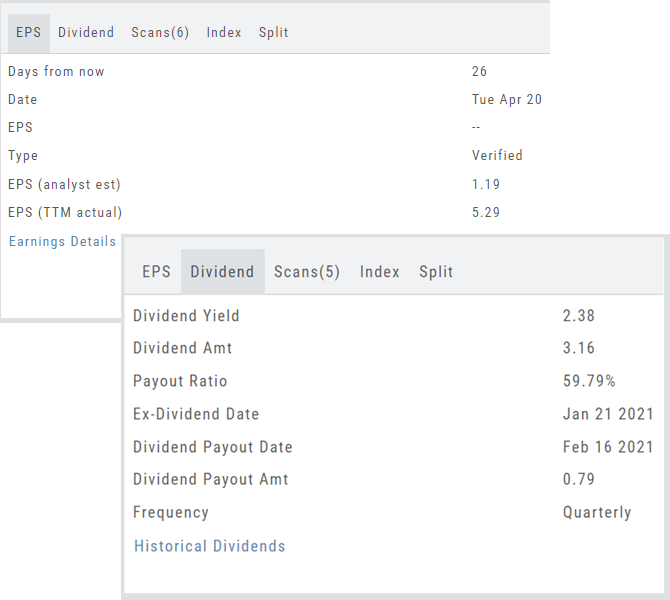
The far right, lower box in Research provides the following:
Earnings Tab: Get Earnings date, number of business days until announcement, Estimated and Actual Trailing Twelve Months (TTM) EPS, and link to the prior 12 Quarter Earnings details.
Dividend Tab: Get Yield, Amount, Payout Ratio (dividend/EPS), the Ex-Dividend Date (deadline to complete a stock purchase to be entitled to dividends), Payout information, Frequency and link to the prior 12 Quarter Dividends.
Scans Tab: Quickly view how many & which scans the stock symbol appears on.
Index Tab: Lists the symbol and indices name(s) on which this stock appears.
Split Date: Provides most recent Split Date, Detail and a link to view Split History
Price Change Indicator
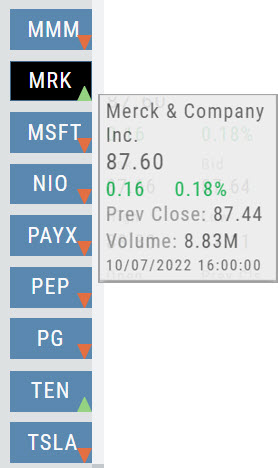
Green and Red Arrows have been added to each symbol tab when in Research.
This applies to any selected Watchlist or the default “Recents” list.
Each time one symbol is clicked, the entire list will update the latest price update.
AI Analysis
Located within the Activity Tab in Research, Stock AI analysis has the potential to enhance and streamline the process of evaluating and trading stocks in the financial markets.
Stock AI analysis can quickly process and analyze vast amounts of financial data, news, and market sentiment in real-time. This enables investors and traders to make more informed decisions based on a comprehensive view of the market.
Click on the AI Analysis Tab for the current symbol you are viewing. A progress bar will appear while the information loads for the initial session view only. The information will remain even if you log out and back in again during the same Market Day.
It’s important to note:
While Stock AI analysis offers these benefits, it also comes with challenges and risks, such as overreliance on algorithms, potential biases in data, and the need for continuous monitoring and oversight. Investors and traders should use AI analysis as a tool to complement their decision-making process rather than relying solely on it.
Designed to provide the level of information you want
As much information you want. When you want it.
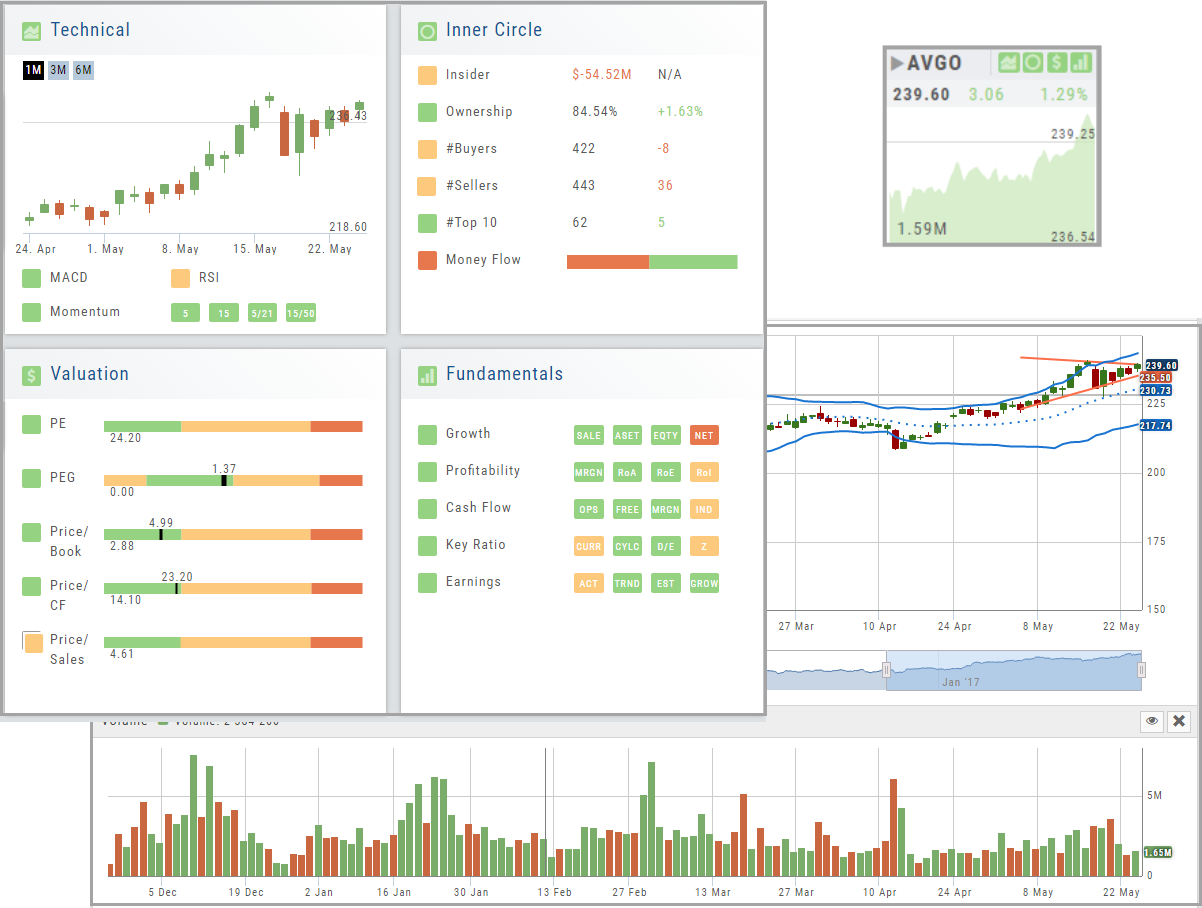
Each of our scoring algorithms are derived from several factors, all captured in a user-friendly format.
The stock dashboard provides a more detail summary layer view of The Score. Each component: Technical, Inner Circle, Valuation and Fundamentals allows you the ability to obtain the information you want, when you want it – and kept tucked away, when you don’t.
Technical analysis
New text — pending review
What the Technical panel measures and how to read it.
Technical Analysis
Technicals: The fastest indicators of The Score
In Technical Score, 3 primary categories of studies are evaluated – MACD, RSI, and Momentum.
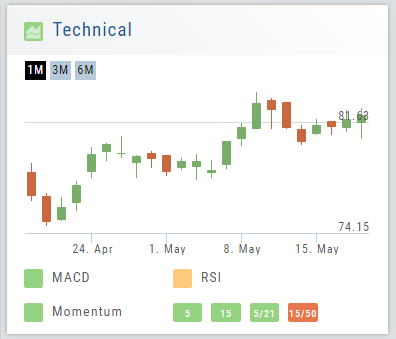
Momentum is made up of 4 different trend analysis timelines.
5 = Stock over the 5-day moving average
15 = Stock over the 15-day moving average
5/21 = 5-day moving average over the 21-day moving average
15/50 = 15-day moving average over the 50 day moving average
Note: Momentum indication is from fastest to slowest. This can be helpful in determining your time frame/outlook for the appropriate strategies.
By clicking on the Technical Score Icon anywhere in the platform, you’ll be taken to the Chart Tab under Research for that Company/Symbol.
Go to Charts for more in-depth information.
The Inner Circle
New text — pending review
What insiders and institutions are doing: the Inside Score, institutional holdings, money flow, and the transaction types behind the filings.
Inner Circle – Behind the Scenes
Insider and Institutional Activity.
Insiders’ and Institutions’ activities in a stock is a powerful tool.
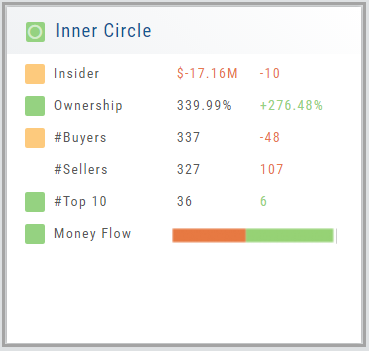
Insiders: Our proprietary Insider Score looks at who the insiders are, how many there are, and how much stock is being bought or sold to derive a score algorithm.
Institutions: We monitor overall and individual institutions’ activities around a stock with historical comparison to evaluate the Institution Score.
You have the ability to delve into as much information as you want by clicking on the ‘Detail’ box in “Insider Score” and “Institutions”. Find top buyers/sellers by week, month, 3 months, or one year. Search Institution Ownership by selected Quarter Report, newly added, reduced, current, top holders, etc. Dive deeper to gain insight into Institutions’ other holdings.
The information is easily accessible when you want it – just by the click of an icon, drop-down box, or arrow.
Inner Circle – Inside Score
The Insider Score window provides insight into the buying/selling activity of Company insiders. Clicking “Detail” provides more in-depth information on such activity.
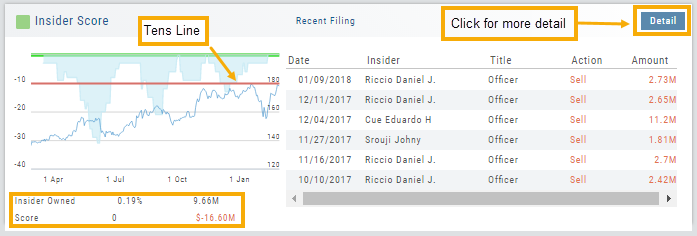
The Tens Line provides a benchmark upon which to base the Inner Circle Score.
Zero & above – indicates net buyers and thus, a Green Score.
Between zero and -10 will yield a Yellow Score, as some insider selling is normal and expected.
A Red Score indicates heavier selling outside of a normal, expected range.
The bottom left of the window shows the % of all shares that are Insider Owned, equivalent $ amount last Quarter, the Score and Net Dollar amount traded last Quarter.
Inner Circle – Institutions
While Insiders are required to update their ownership status within a few days. Institutions are required to do so Quarterly.
The main tile shows data from the most recent reporting Quarter.
% Institutional Ownership and % change (+/-) from the previous Quarter
# of Buyers/Sellers with number gain/loss.
# of Institutions where the Stock is in their Top 10 Holdings
Note the Deadline for the Q1 2018 Report.
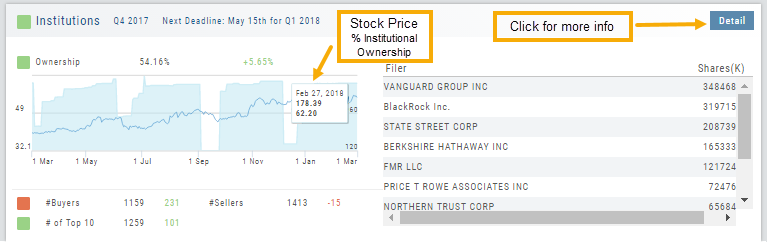
While the # of Buyers grew by 231 in Q4 2017, the number of Sellers outweighing buyers was enough to give this component a Red Score.
The # of Institutions holding AAPL grew enough to have a Green Score.
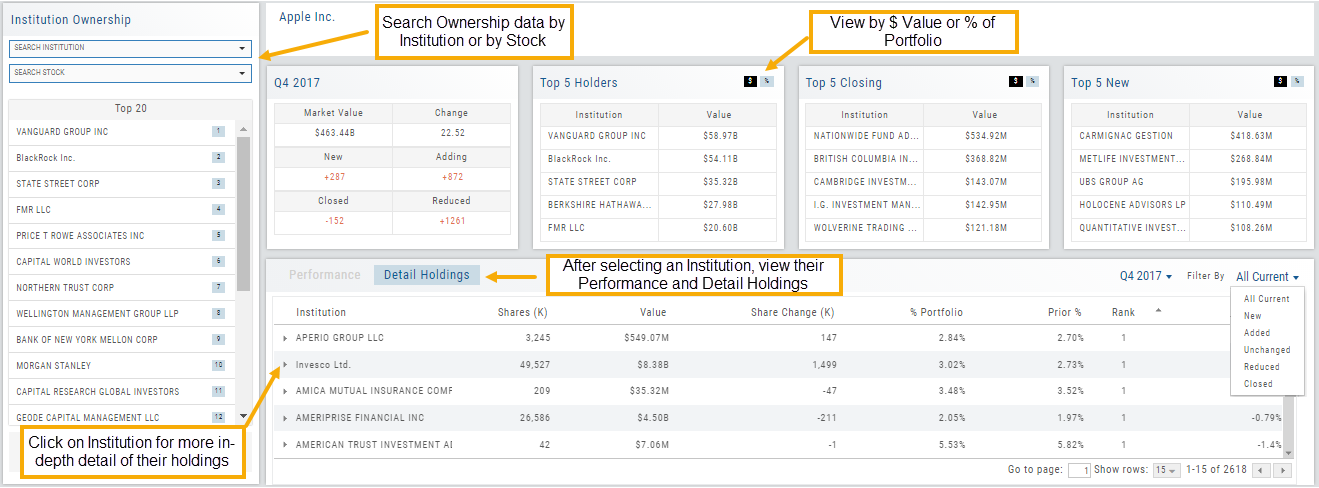
Clicking on “Detail” provides information on the last 20 Quarters. The information is layered allowing you to research ownership data further by Institution or Stock. You can further filter the ownership by those who added, reduced, dropped, unchanged etc. View holdings as a $ value or as a % of the Institutions’ portfolios.
Inner Circle – Money Flow
Activity by volume & number of trades
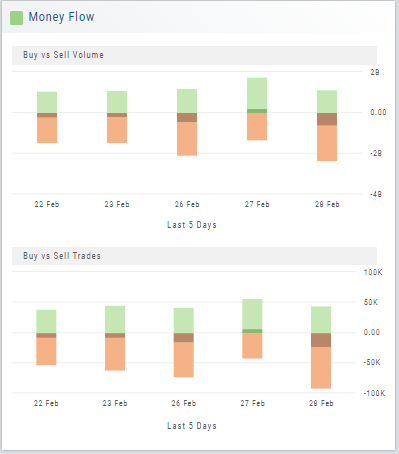
Money Flow shows trading activity in two views.
The darker shade in the middle of each column – either dark green or red- indicates difference between the buy/sell volume and buy/sell number of trades.
For example, on February 27th, the top graph shows approx. 1.75 Billion buying volume from just over 50k trades (bottom graph). Selling volume of approx 1.5 B resulted from less than 50k trades.
Where the volume and trade columns overlap is an indication of ‘big money’ (Institutions) moving in (dark green) or out (dark red) of the stock.
Note the dark green line overlap on both graphs for the Feb. 27th example.
Trade Transaction Types
Type of transaction (from SEC Insider Form 4)
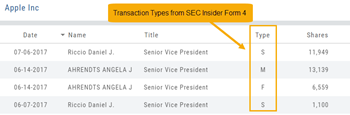
General Transaction Codes
P — Open market or private purchase of non-derivative or derivative security
S — Open market or private sale of non-derivative or derivative security
V — Transaction voluntarily reported earlier than required
Rule 16b-3 Transaction Codes
A — Grant, award or other acquisition pursuant to Rule 16b-3(d)
D — Disposition to the issuer of issuer equity securities pursuant to Rule 16b-3(e)
F — Payment of exercise price or tax liability by delivering or withholding securities incident to the receipt, exercise or vesting of a security issued in accordance with Rule 16b-3
I — Discretionary transaction in accordance with Rule 16b-3(f) resulting in acquisition or disposition of issuer securities
M — Exercise or conversion of derivative security exempted pursuant to Rule 16b-3
Derivative Securities Codes (Except for those exempt pursuant to Rule 16b-3)
C — Conversion of derivative security
E — Expiration of short derivative position
H — Expiration (or cancellation) of long derivative position with value received
O — Exercise of out-of-the-money derivative security
X — Exercise of in-the-money or at-the-money derivative security
Other Section 16(b) Exempt Transaction and Small Acquisition Codes (except for Rule 16b-3 codes above)
G — Bona fide gift
L — Small acquisition under Rule 16a-6
W — Acquisition or disposition by will or the laws of descent and distribution
Z — Deposit into or withdrawal from voting trust
Other Transaction Codes
J — Other acquisition or disposition (describe transaction)
K — Transaction in equity swap or instrument with similar characteristics
U — Disposition pursuant to a tender of shares in a change of control transaction
Valuation and Key Ratios
New text — pending review
How the platform grades a stock’s price: the Valuation gauges, the Key Ratio tab that grew out of them, and the Compare tab for judging a stock against its industry peers.
Valuation
Is it Overvalued or Undervalued?
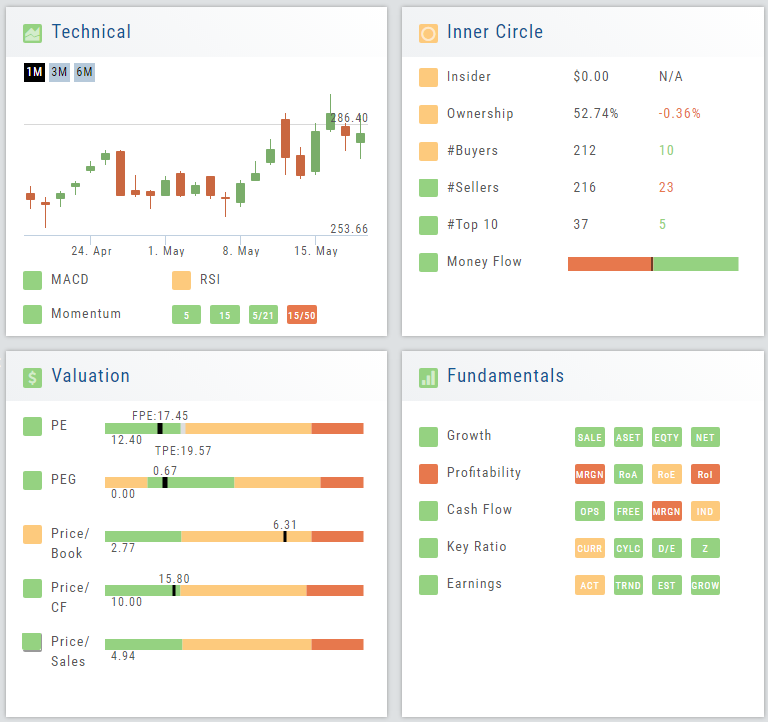
Valuation looks at Key Ratios and Projected Price to evaluate the stock’s current value. Key Ratios like both trailing and forward PE along with PEG (Price/Earnings/Growth) are weighed.
The Price compared to Book (flow of business), Cash Flow, and Sales are also very important factors to provide a well-rounded synopsis of the valuation modeling of the stock.
Key Ratio (formerly Valuation)
Key Ratio
A stock’s key ratios provide valuable insights into various financial aspects of the company. They are derived from the financial statements and help investors evaluate the company’s financial health, performance, and overall investment potential.
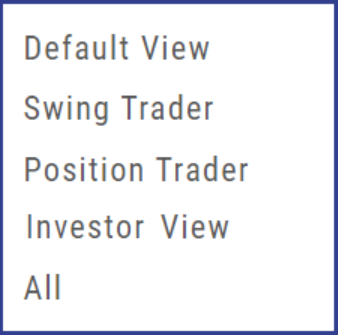
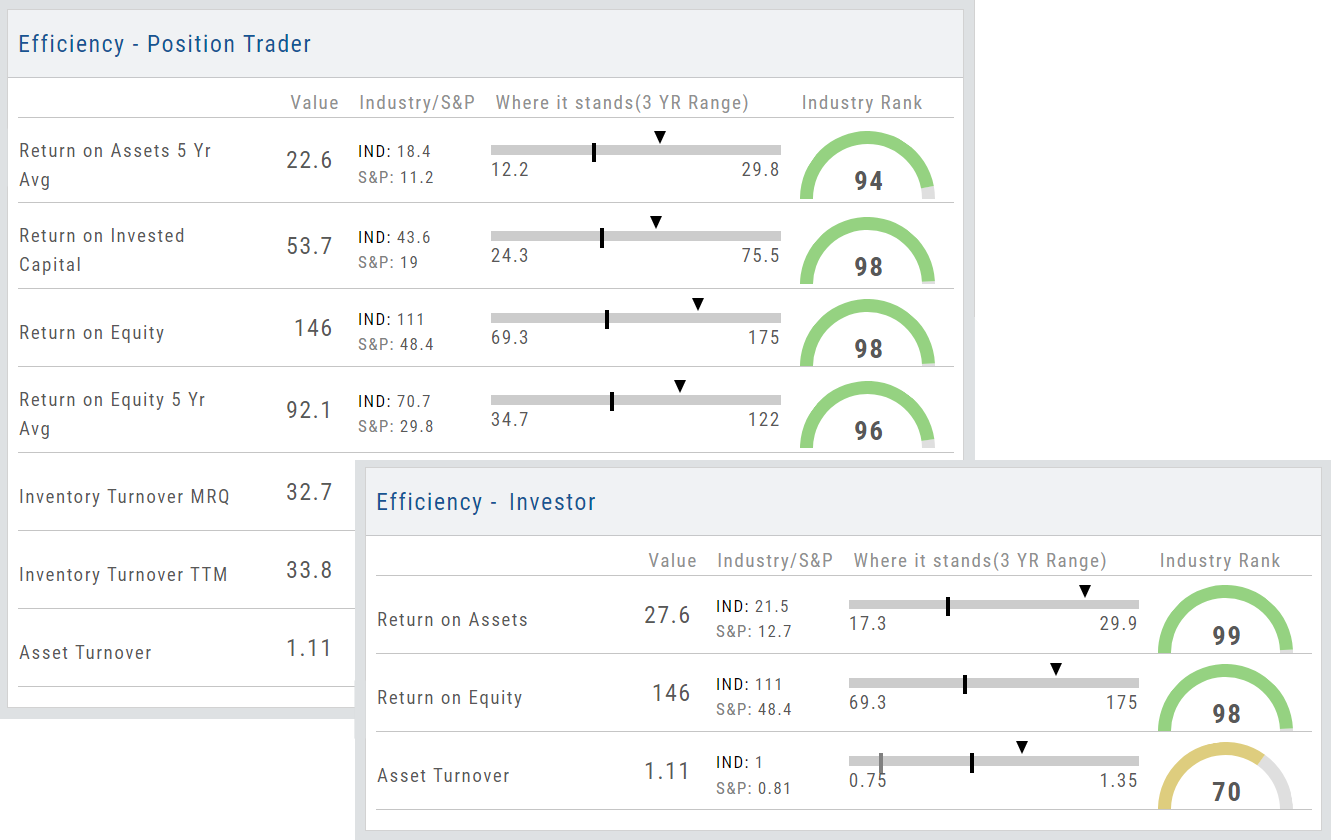
Assessing Key Ratios may vary by the type of trader one is: Growth Investors differ from Swing Traders who differ from Position Traders. The platform offers different views using Key Ratios for such scenarios.
Key Ratios allow you to not only view the company’s financial health but also view them in relation to others in the same industry, comparing ‘apples to apples’. Having this information allows you to better evaluate potential opportunities.
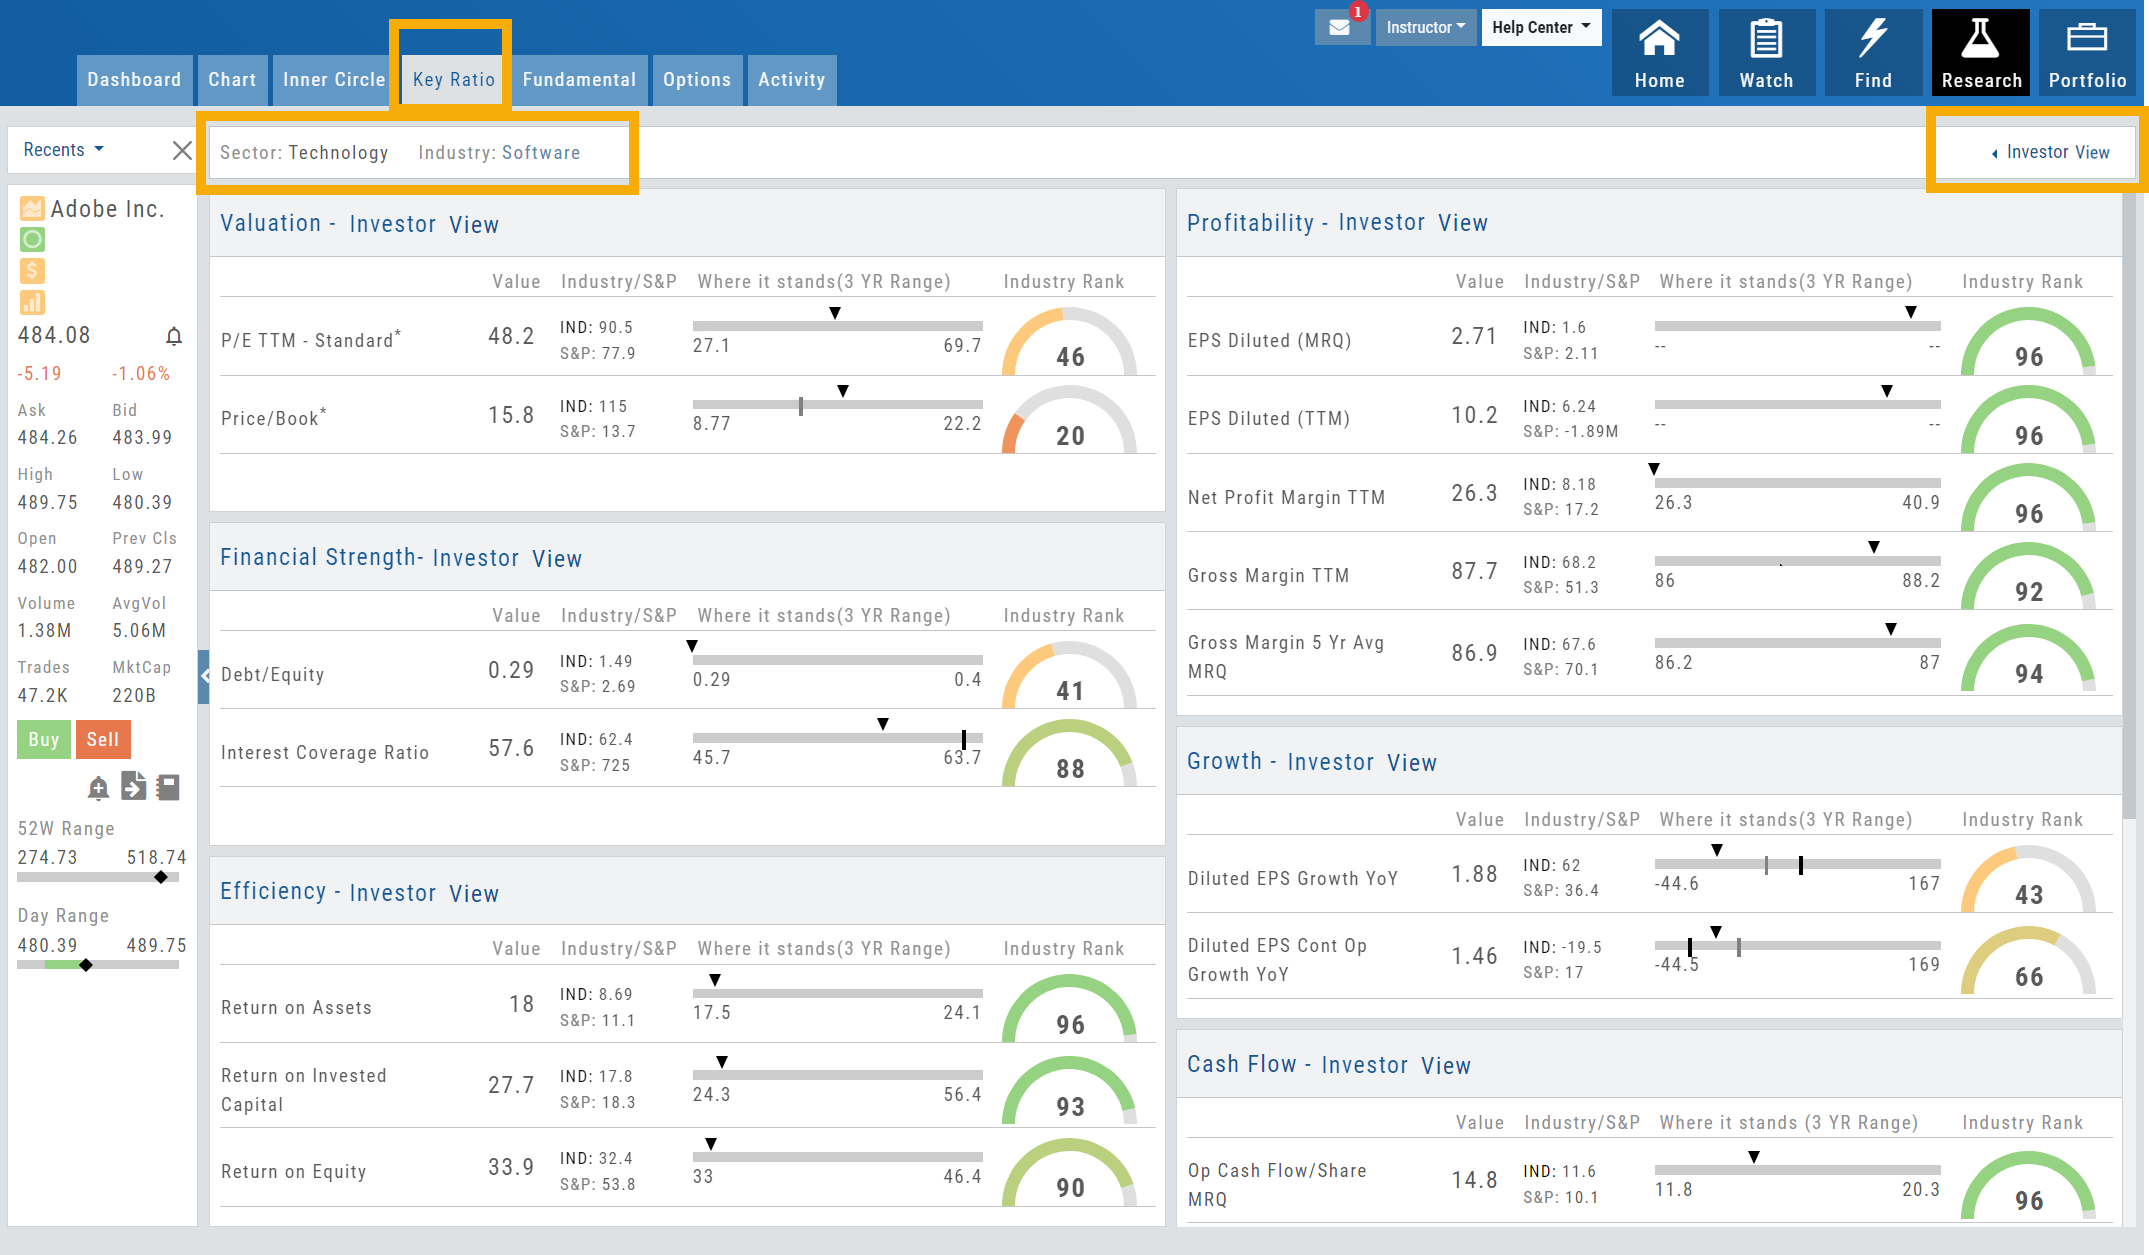
Deciphering the graphics
The illustrations show how to read the information provided as well as provide context on how the particular stock is performing to the Industry as well as the S&P.
Note: Depending on the Industry and/or S&P values, their tab(s) may not appear on the bar graph.
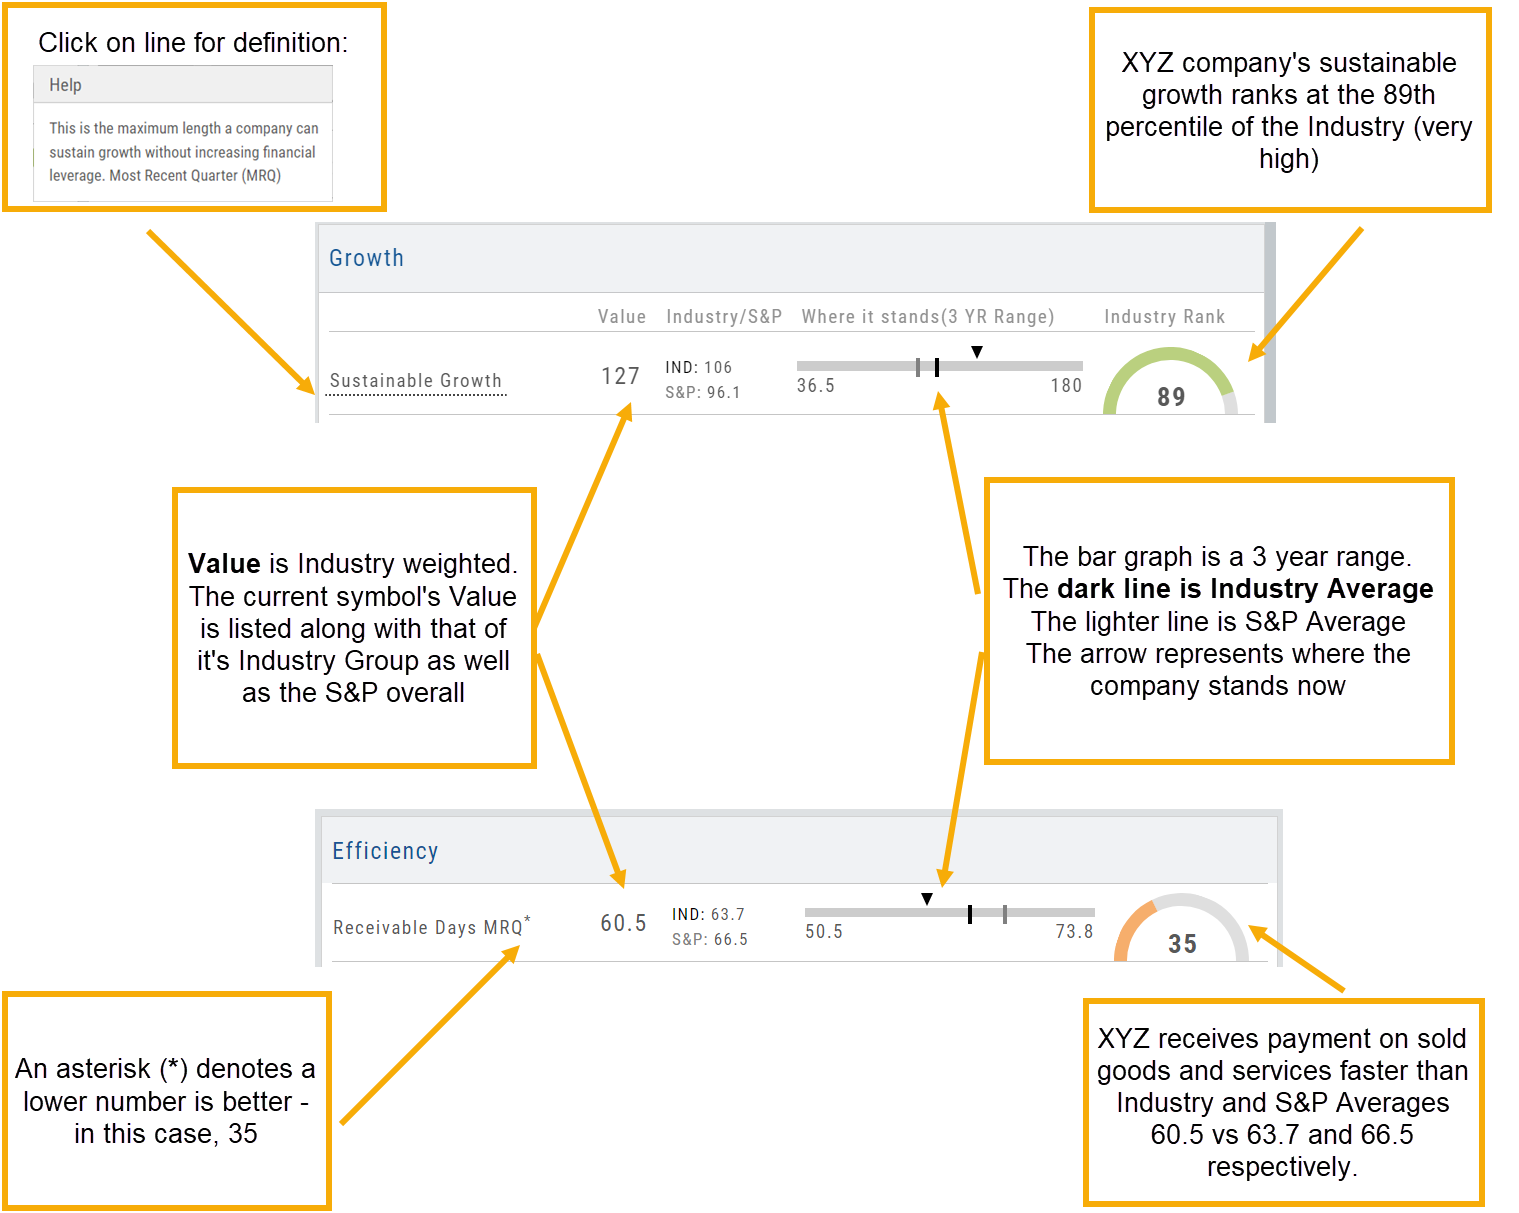
Select the view that matches your style of trading.
Just like trading, there is no ‘one-size-fits-all’. Those focusing on longer-term trades would not be interested in the same criteria as those who prefer shorter-term positions.
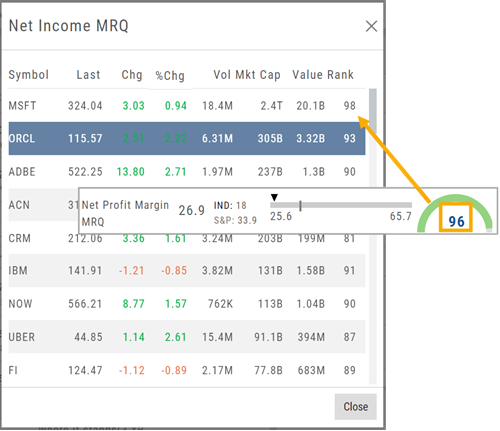
Clickable Key Ratio Value
View other industry stocks’ ranking by clicking on the numeric value as shown.
What does “N/A” or “–” indicate?
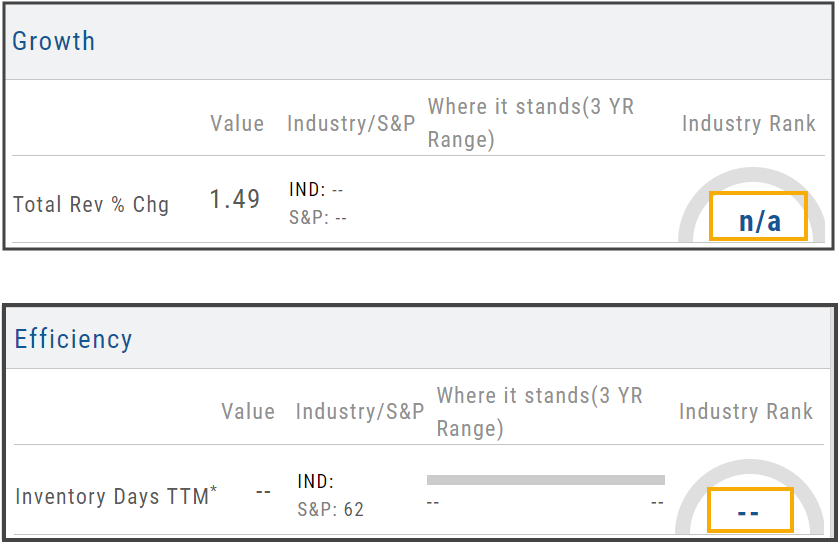
If a number does not appear in the Ratio criteria, you will see either a “N/A” or “—“
N/A indicates the datapoint is applicable, but the value is not currently available
— indicates the data point does not apply, such as Inventory Ratios with Banks
Compare Tab
The Compare feature, found under the Research Tab, allows investors to review a particular stock against its industry peers. Different Views offer Investors perspectives with different investment strategies, such as value or growth investing, to identify stocks that align with their preferred strategies within a specific industry.
Some of the Compare benefits include:
- Relative Valuation: Ratios like price-to-earnings (P/E), price-to-sales (P/S), or price-to-book (P/B) can be assessed whether a stock is overvalued or undervalued relative to its peers.
- Identifying Outliers: If a company has significantly different ratios compared to its peers, it may warrant further investigation to reveal potential investment opportunities or risks.
- Industry Trends: Analyzing ratios across an industry can reveal trends and patterns. For example, if the majority of companies in an industry experience a declining profit margin, it may indicate a broader industry challenge or trend.
- Risk Assessment: Comparing key ratios can help assess the financial health and risk profile in an industry context. Companies with lower debt-to-equity ratios, for instance, may be considered less risky, especially if this trend holds across the industry.
- Operational Efficiency: Comparing Ratios like return on equity (ROE) and return on assets (ROA) among industry peers can provide insights into a company’s operational efficiency.
NOTE:
While comparing key ratios within an industry offers valuable insights, it’s VITAL to consider other factors, such as the company’s business model, competitive advantages, management quality, macroeconomic conditions, etc. Ratios should be only part of a broader analysis to make well-informed investment decisions.
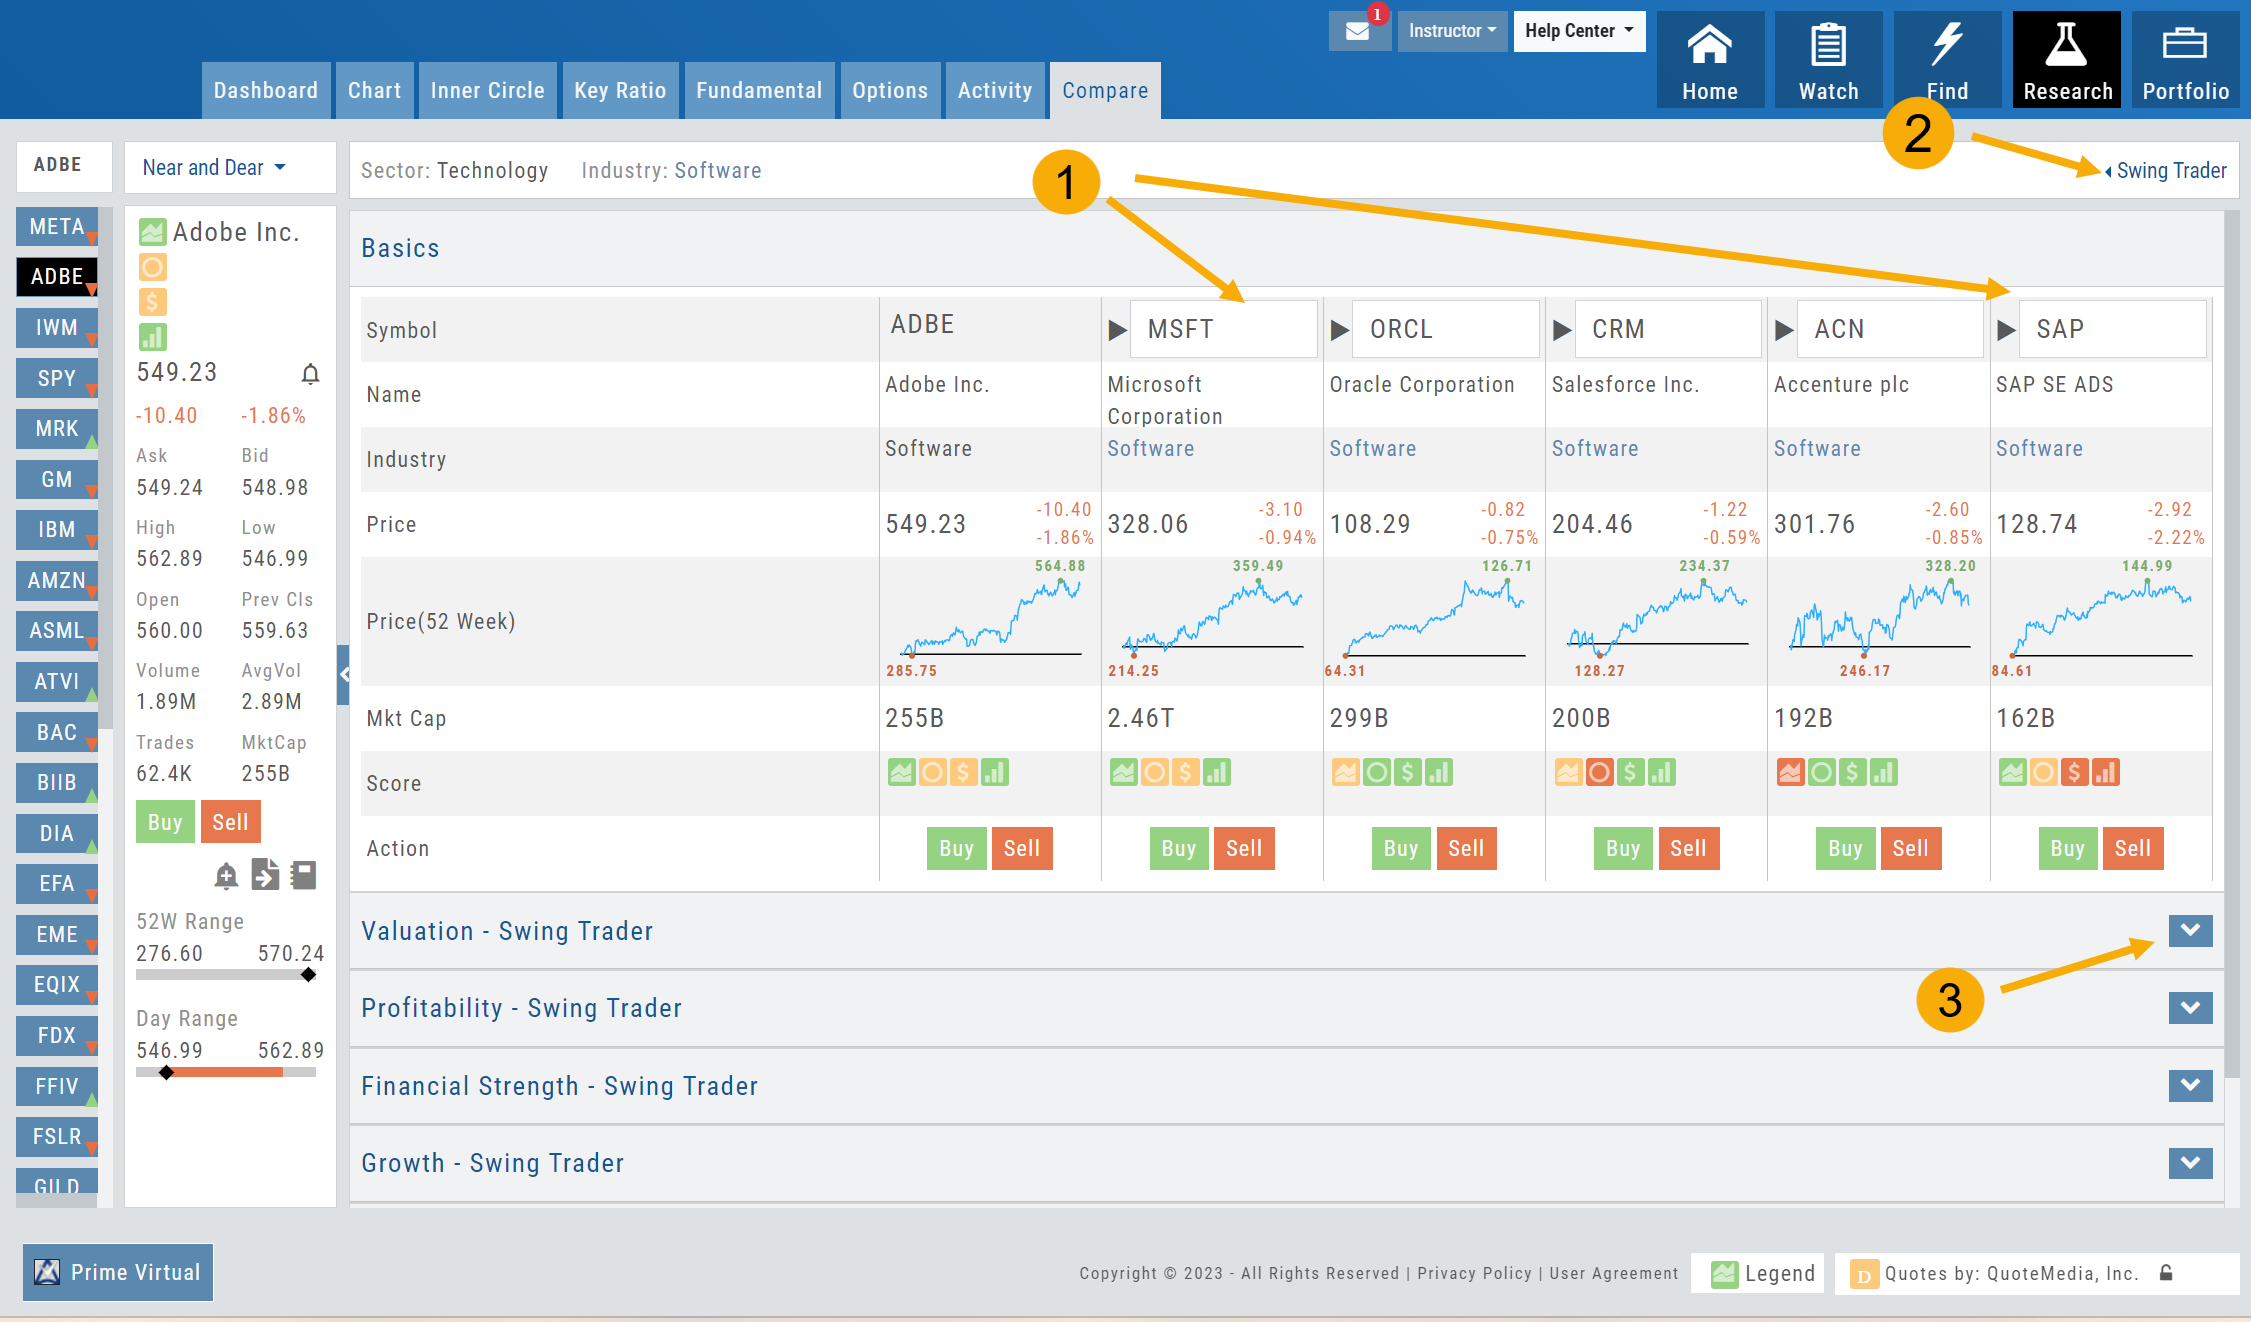
The fields automatically populate with industry peers. They can be changed to compare other symbols of your choice.
Fundamentals
New text — pending review
The company behind the ticker — growth, profitability, cash flow, and the full Fundamentals tab.
Fundamentals
A complete perspective of performance in one place.
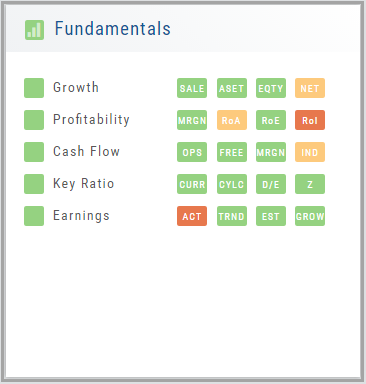
Fundamentals looks at 20 critical financial analysis ratios in 5 different categories: Growth, Profit, Cash Flow, Key Ratios, and of course, Earnings.
We also take into account Quarter over Quarter, Year over Year, and Trailing Twelve Months’ (TTM) performance with our proprietary weighting formula. View historical data by clicking on the upper right corner buttons in each window.
Fundamentals is the slowest of The Score components to affect stocks, due to the limited times throughout the year data is released. Active investors would generally place more weight on Fundamentals than would a very short-term trader.
Fundamentals Tab
Fundamentals
Fundamentals provide valuable insights into the financial health and performance of a company. They offer a comprehensive analysis of the company’s operations, profitability, growth potential, and overall stability.
Fundamentals are comprised of Earnings, Dividends, Price Projections, Profitability, Growth, and Cash Flow.
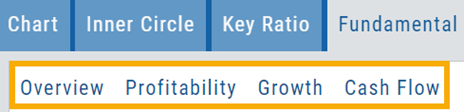
Profitability, Growth, and Cash Flow offer even more detail. Either click the button in that section:

OR click the appropriate category at the top of the window:
Earnings
Earnings data provide insight into a company’s financial health and performance.
Past earnings reports offer insight into the company’s historical growth, profitability, and stability. Positive earnings trends may indicate a well-performing company. Negative or declining earnings could be cause for concern.
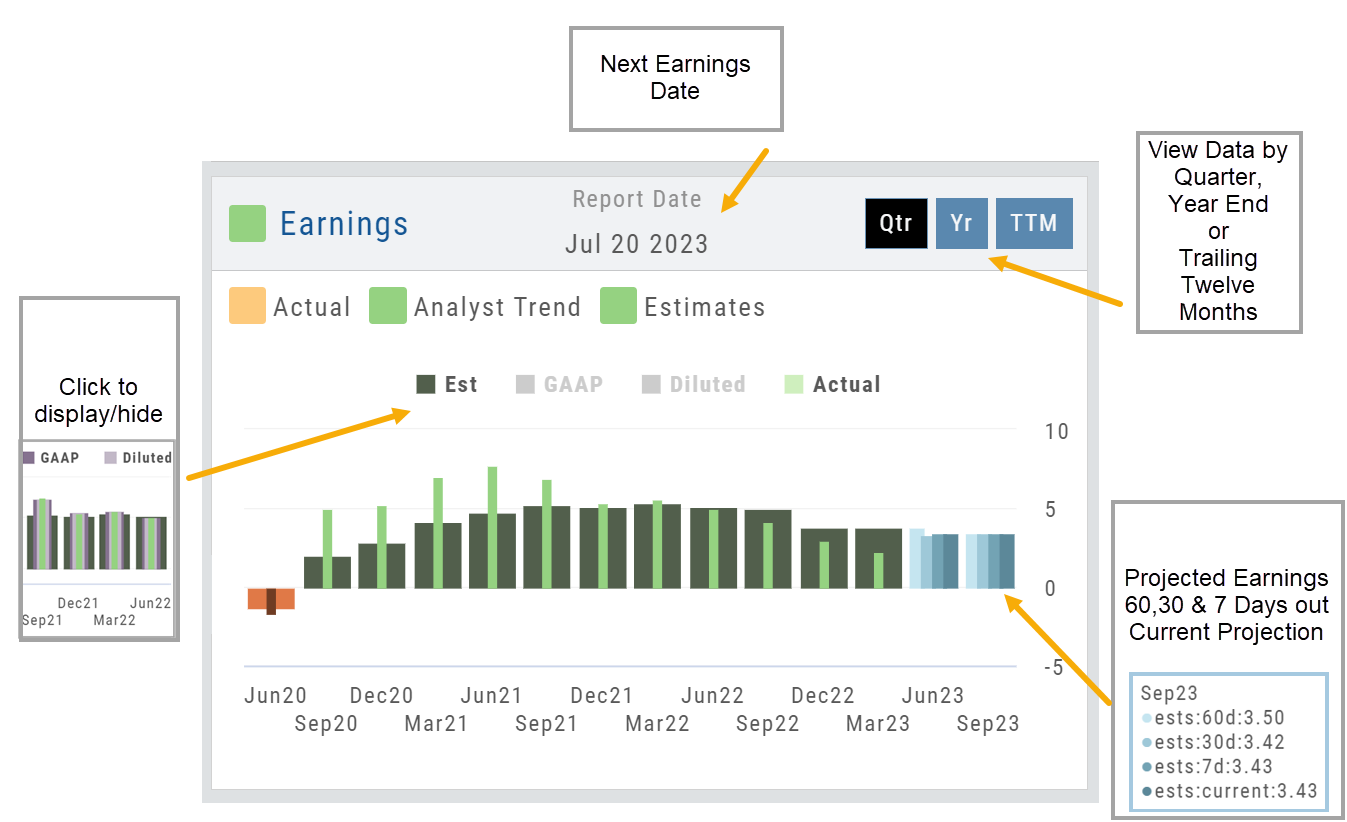
Earnings projections provide forecasts of a company’s future earnings to gauge Market sentiment and investor expectations. Projections are compiled by financial analysts using factors such as industry trends, company guidance, and economic conditions. Surpassing or falling short of projections can greatly impact stock price.
Dividends
The decision to pay dividends is up to the company’s management and board of directors, who weigh various factors, including the company’s financial position, growth prospects, and other capital allocation priorities. Dividend payouts are not guaranteed and may fluctuate or be suspended based on the company’s circumstances and strategic considerations.
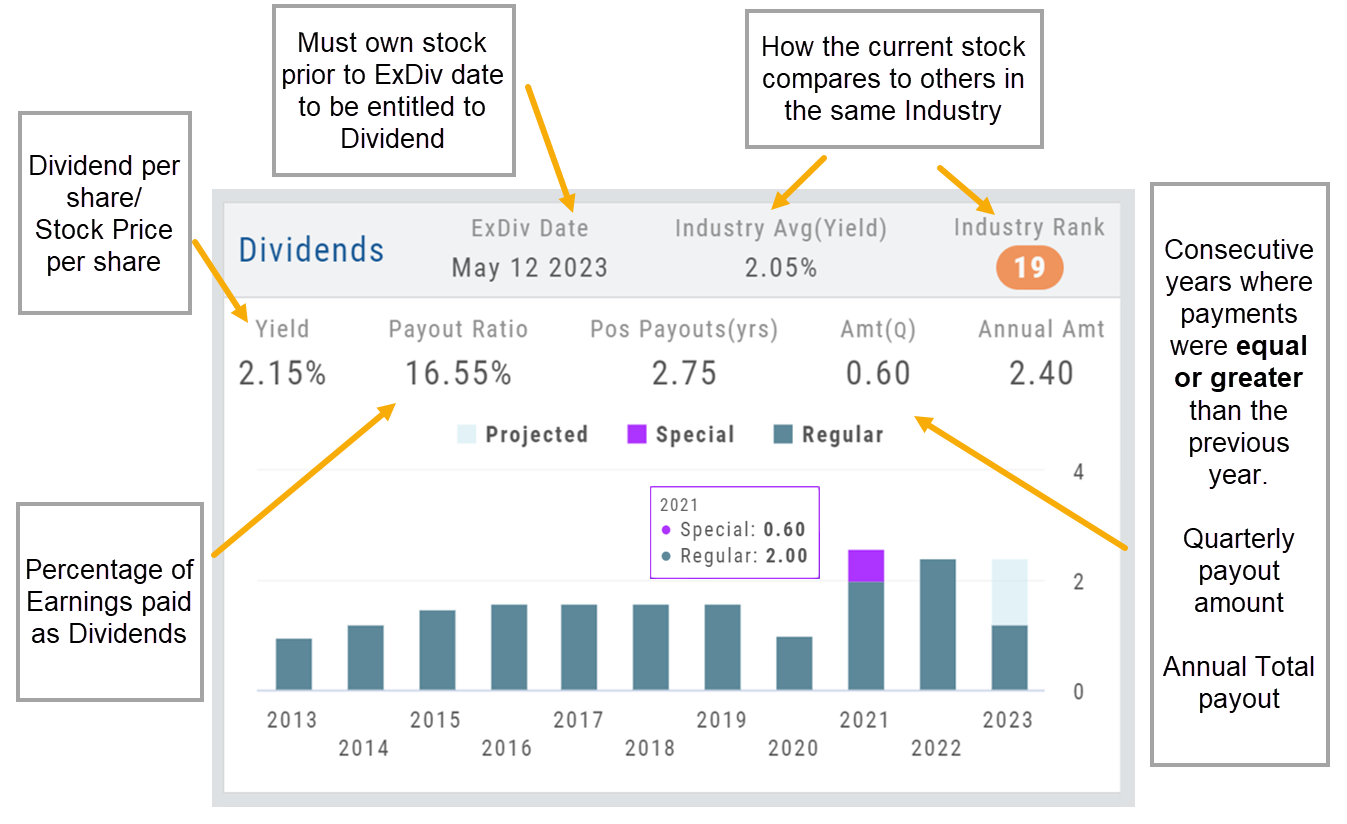
Some benefits to both the company and shareholders include:
Income Generation
Shareholder Loyalty
Return on Investment
Dividend Reinvestment
Signal of Financial Health
Possible Tax Advantages
Disciplined Capital Allocation
Price Projection
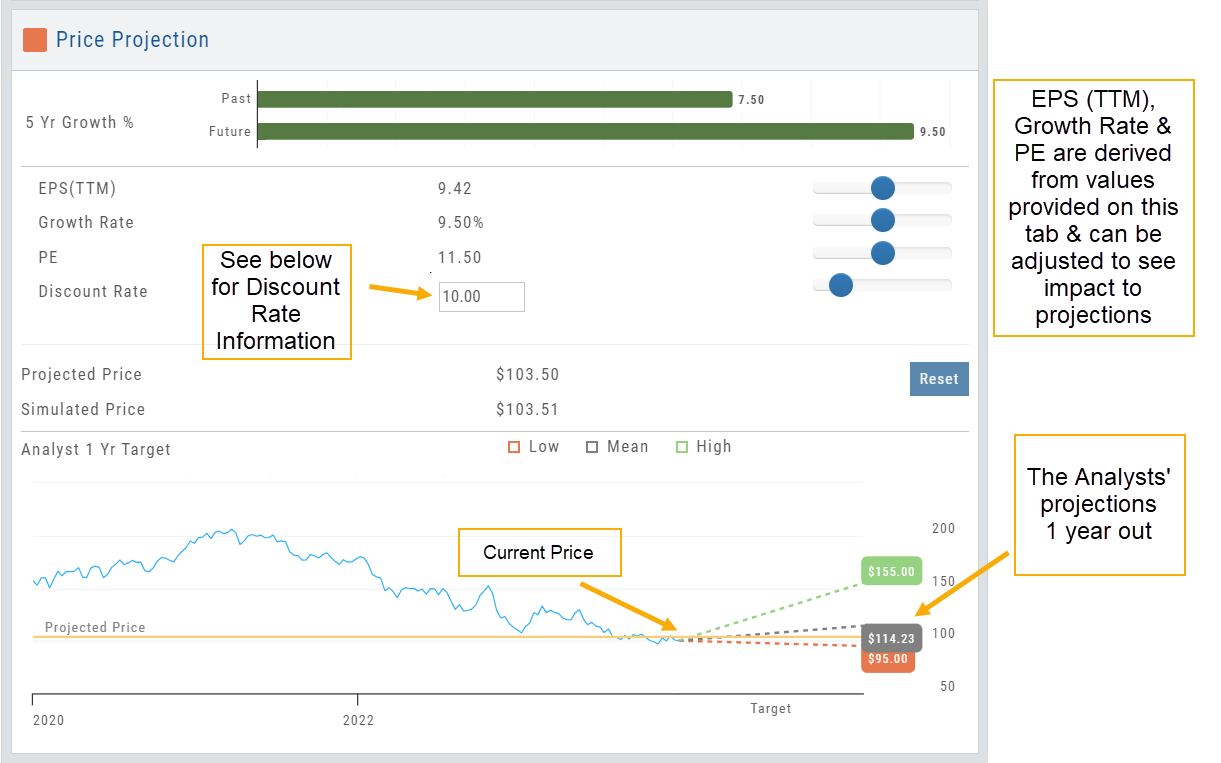
Discount Rate
Determining the appropriate discount rate for a stock is a subjective process and depends on various factors.
Here is an example:
- Risk-Free Rate: Start by considering the risk-free rate, (the theoretical rate of return on a risk-free investment such as government bonds). This serves as a baseline for the discount rate. An online search can locate this information for you.
- Risk Premium: Assess the risk associated with the specific stock you are evaluating. Stocks are inherently riskier than risk-free investments, so you need to add a risk premium to the risk-free rate. The risk premium accounts for the additional return expected by investors for taking on the extra risk. The risk premium can vary depending on factors such as industry, company-specific risks, economic conditions, and market volatility.
- Beta: This measures its sensitivity to market movements.
Beta of 1 = the stock moves in line with the overall market
Beta > 1 = the stock has higher volatility and would warrant a higher discount rate to reflect the increased risk. - Company-Specific Factors: Are there unique company factors (financial health, competitive position, growth prospects, management quality, etc) that could positively or negatively influence the discount rate?
- Sensitivity Analysis: Changing the discount allows you to assess the impact of the stock’s valuation. Some sectors are subject to more volatility than others: the Energy and Material Sectors tend to be more volatile than Consumer Staples or Utility Sectors.
The discount rate is subjective. Different investors might have different views on what the appropriate discount rate is for a given stock, based on their own risk tolerance, the specific risks associated with the company, and their expectations for future market conditions.
Profitability
Revenue: Money generated from sales of goods or services. It is income earned prior to deducting expenses or costs
Cost of Revenue: Expenses directly related to production, manufacturing, or acquisition of products/services sold. Typical examples include raw materials, labor, overhead, etc.
Operating Expenses: Day-to-day, necessary operating expenses not directly related to the production/acquisition of goods/services. Examples: Wages, utilities, depreciation, advertising, etc.
Other Expenses: Depending on the nature of the business can include: Taxes, Interest, Non-operating losses, Restructuring, Non-recurring, etc.
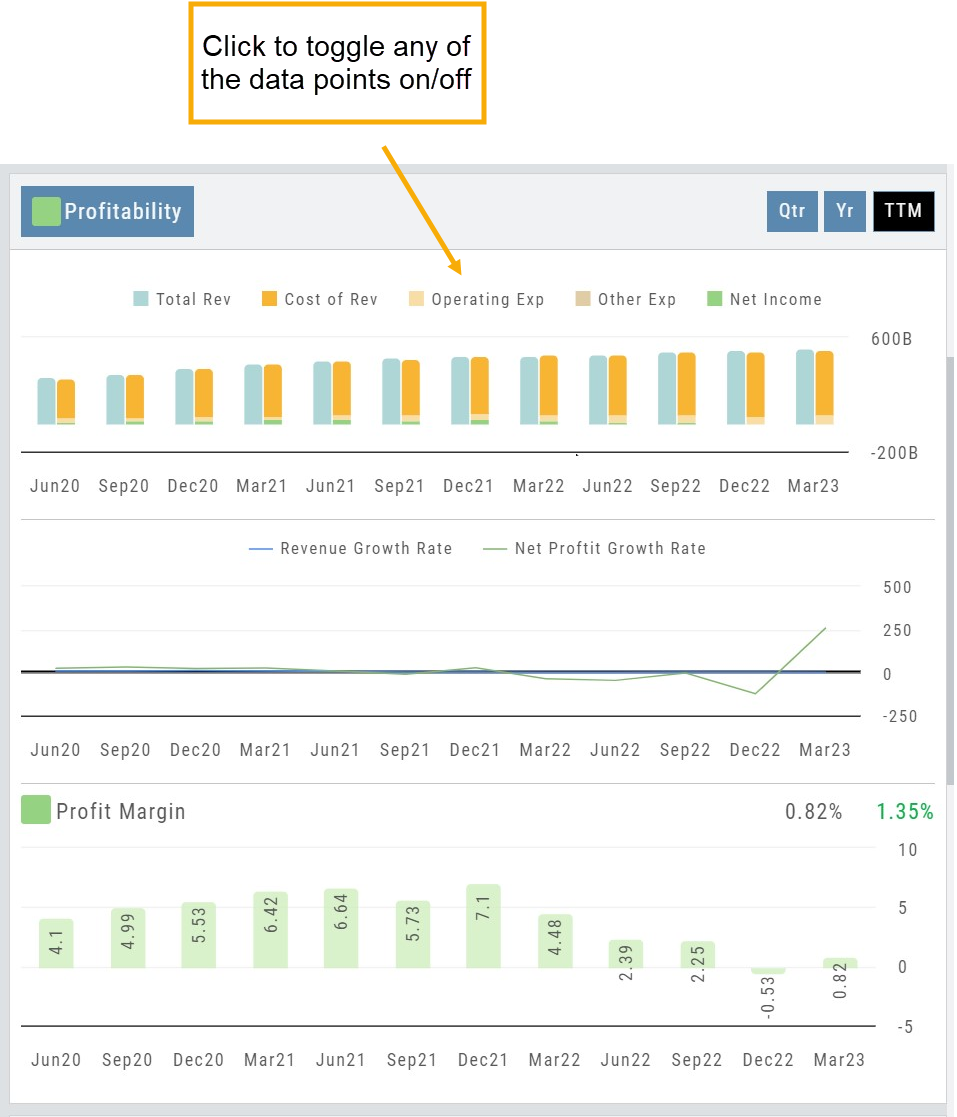
Revenue Growth Rate: Percentage change (+/-) in a company’s sales/revenue over a period of time:
Revenue Current–Revenue Previous/Revenue Previous x 100
Net Profit Growth Rate: Percentage change (+/-) in a company’s net profit over a specific period of time:
Net Profit Current–Net Profit Previous/Net Profit Previous x 100
Profit Margin: Percentage of revenue a company retains after deducting all expenses.
A higher profit margin indicates a company is generating more profit relative to its revenue. A lower percentage suggests higher expenses in proportion to revenue.
Growth
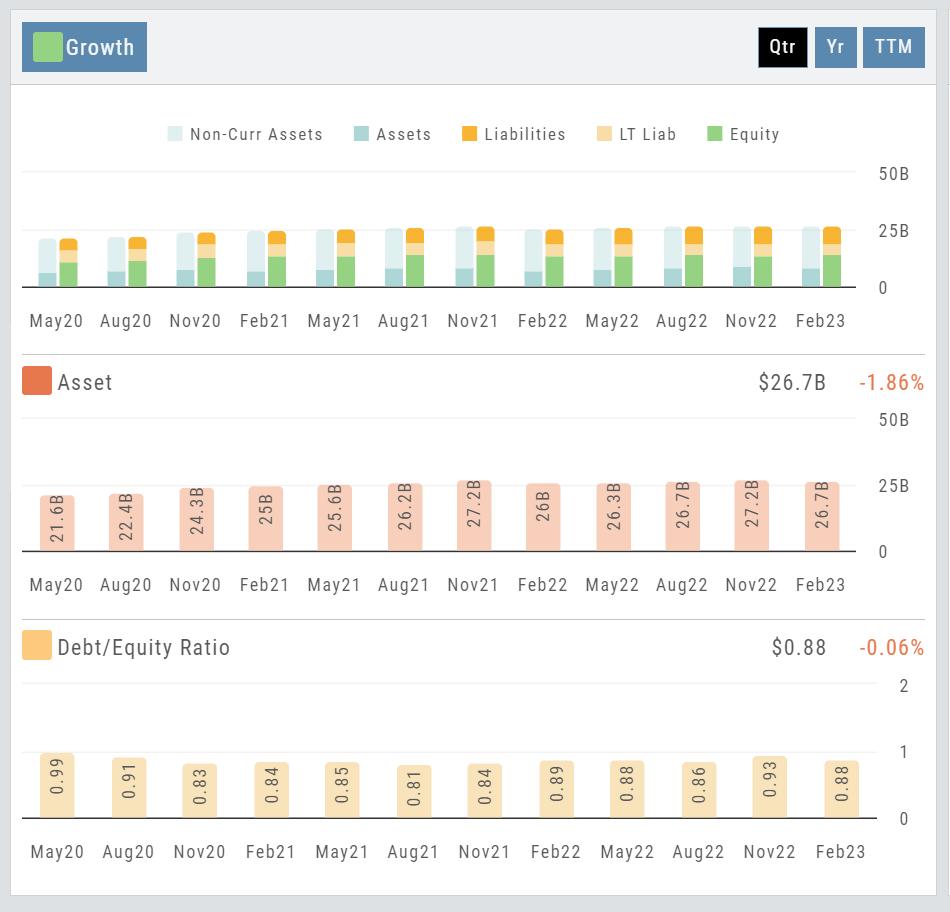
Asset: These can vary by industry/company. Common examples that contribute to a company’s growth are Financial, Intellectual Property, Human Capital, Physical Assets, Technology/Info Systems, Customer Base, Brand Equity, Partnerships, and Networks.
Debt/Equity Ratio: Total Debt divided by Total Equity. Interpretation varies by industry and a company’s specific circumstances: a high ratio can indicate higher financial risk OR effective management of debt through cash flow. A low ratio can indicate a conservative financial position OR under-utilization of debt and missed opportunities for growth.
Non-Current Assets: Resources not intended to be converted into cash or used up within a year.
Assets: Anything of value that has the potential to generate future economic benefits.
Liabilities: Obligation or debt a company owes to external parties that must be fulfilled in the near future.
Long-term Liabilities: Obligation or debt a company owes but has more than a year to repay.
Equity: The portion of a company’s value belonging to its owners or shareholders after all debts and obligations have been settled.
Cash Flow
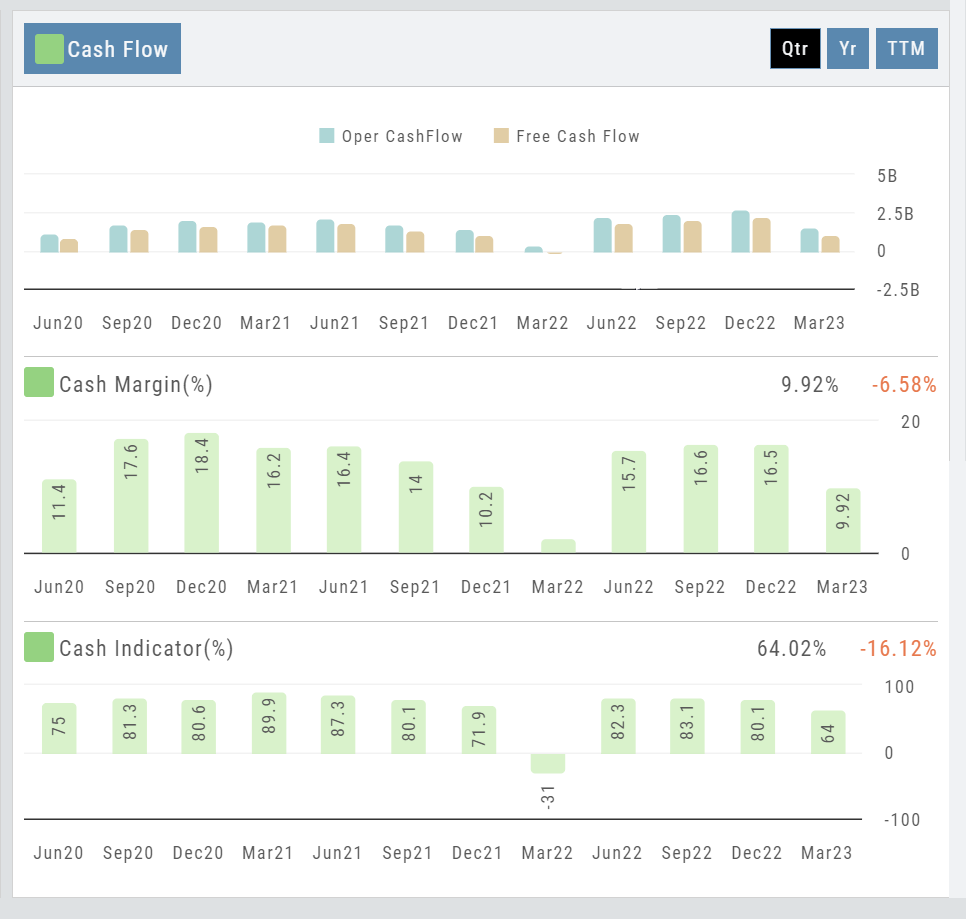
Operating Cash Flow: Represents the cash inflow/outflow directly related to day-to-day activities including sales of goods and services, paying operating expenses, and collection of receivables.
Free Cash Flow: Cash flow available for discretionary use after accounting for operating expenses, capital expenditures, and changes in working capital. Positive values offer opportunities, negative values may indicate financial challenges.
Cash Margin %: Percentage of cash generated from a company’s sales revenue after deducting its cash operating expenses. It measures the profitability and efficiency of a company’s operations to generate cash.
Cash Indicator: The industry percentile ranking of a company’s ability to generate cash from its operations.