
Announcing the latest Release of feature and functionality enhancements to the trading platform to improve the investment/trading decision process.
Economic Dashboard: View chart data from dozens of economic reports. Includes information on why it is important, what to look for, and how to apply the data to trading.
Chart Adjustment: Ability to compress and expand y-axis.
Chart Periods: New look, improved functionality.
Economic Dashboard
Located under the Home/Market Tab, this powerful research tool provides important economic information in chart format. 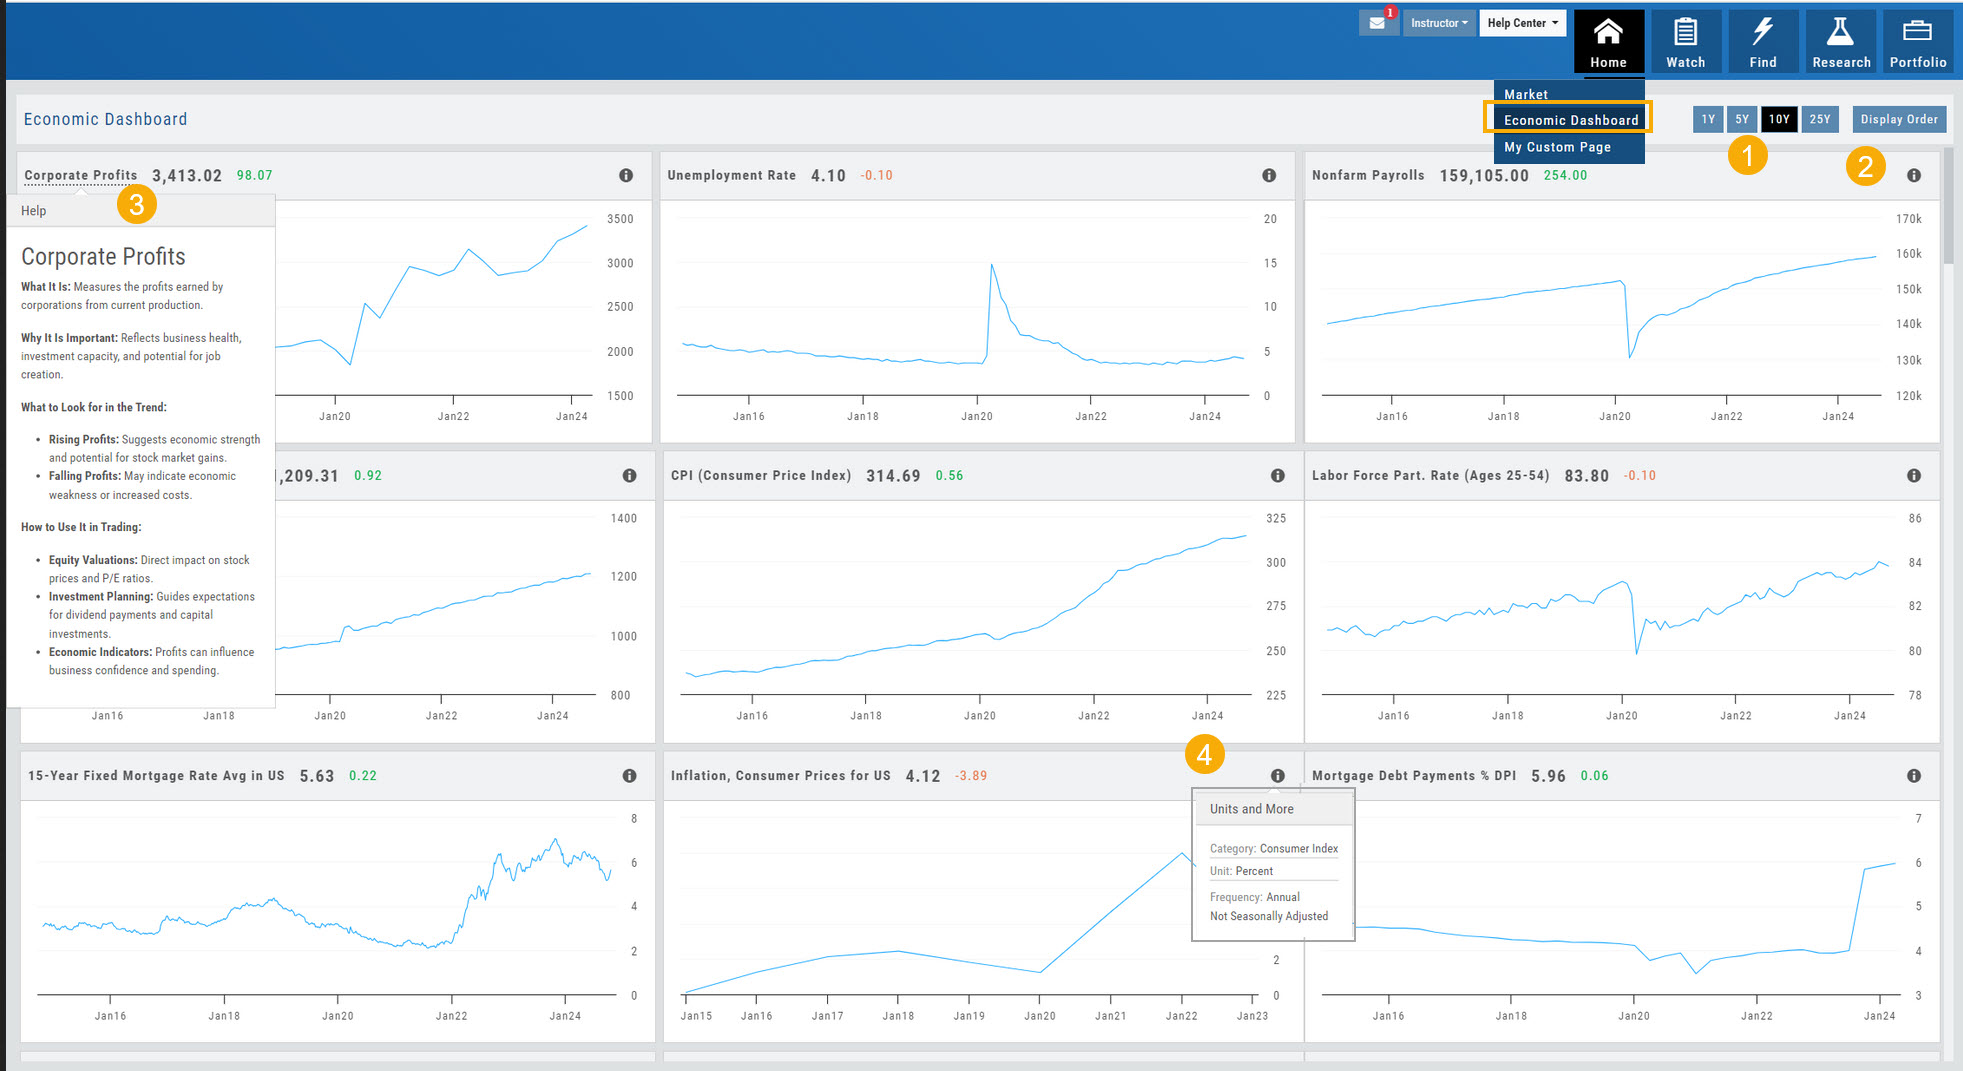
- Select from 1*, 5,10 or 25-year views
- Allows you to select display order as well as ‘hide’ charts.
- Click on the Title to display: What the data represents, Why it is important, What to look for and How to apply the data in trading
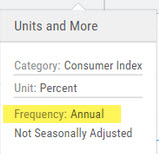
- Provides info on the Economic Report Category (Consumer), what the numbers represent (%, $, units, etc), how Frequent the data is reported (Quarterly, Annually, Monthly, etc)
* Some reports are released annually. 5, 10 or 25 year view are recommended in these instances.
Simply click you cursor to the right of the y-axis, then drag your mouse/cursor up or down.
Chart Adjustment/y-axis
Chart Adjustment
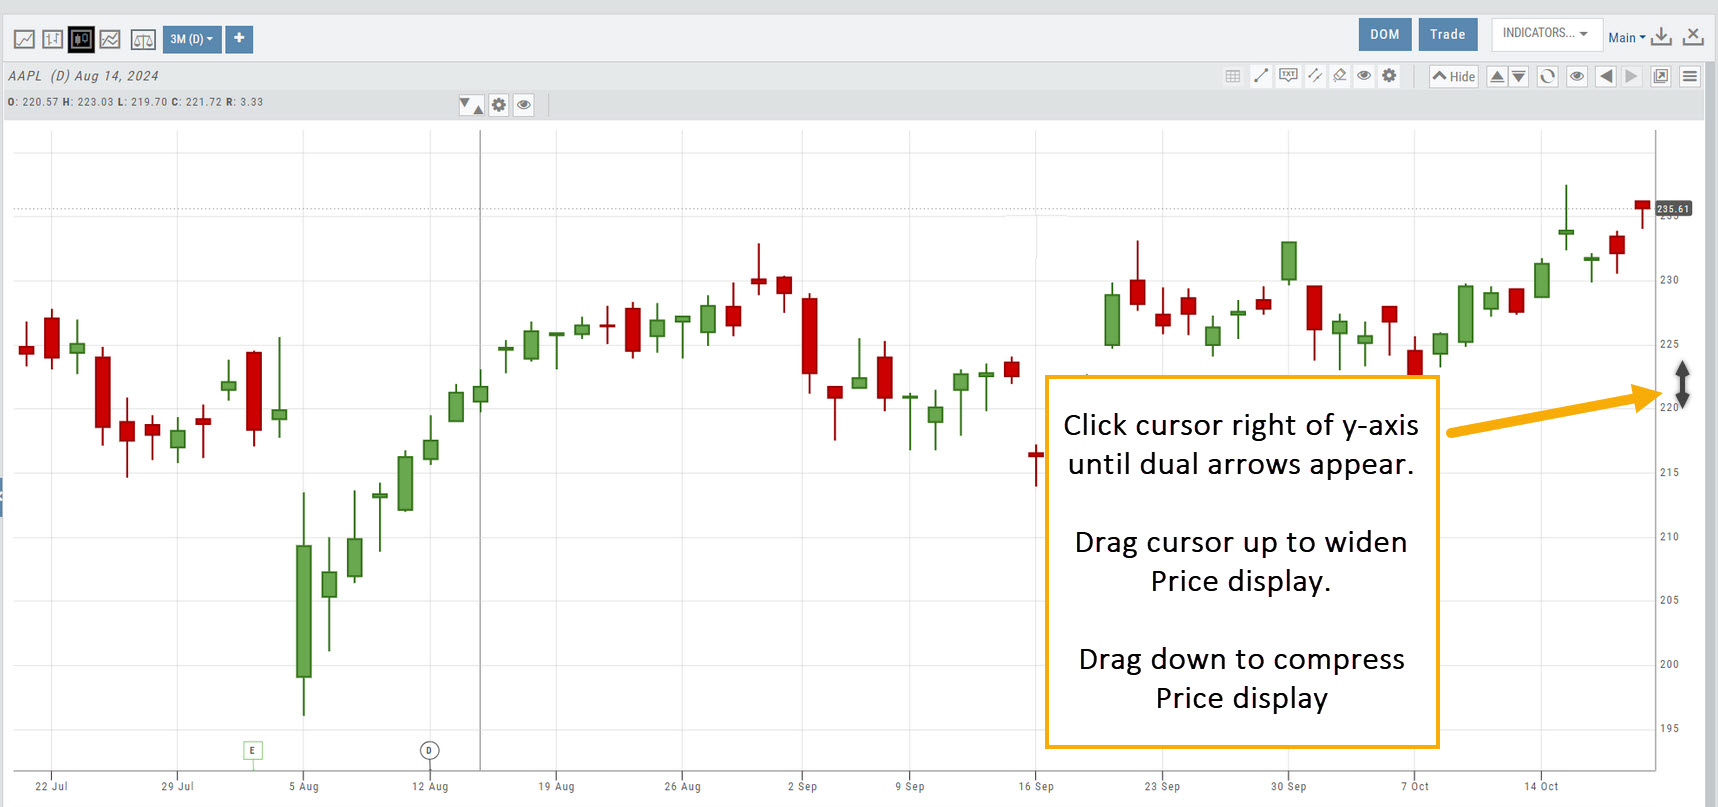
Adjusting the chart’s y-axis gives you more flexibility – whether it’s forecasting, adding notes, viewing current positions, etc.
Simply click your cursor to the right of the y-axis, then drag your mouse/cursor up or down.
To reset, click the ‘refresh’ icon  on the chart toolbar
Chart Time Periods
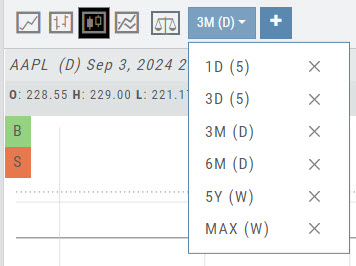
The Chart Period format has been streamlined for a cleaner look.
The current chart period will be displayed at the top of the ‘favorite’ (saved) drop-down list.
Change Log
- ‘x’ moved to left side of symbol list in Research Tab
- Key Ratio and Compare Views are session sticky
- Seasonal chart corrected to show Price
- Cancel/Reuse display on Credit orders corrected
- Stock data restored on Scan backtest
- Staged Order display on chart functionality corrected
- Schwab Order Ticket close orders corrected
- Trade Station added under “Open New Account”
- Reward/Risk more clearly marked on Trade from Chart
- 1 Day/1 Minute added to Custom Page charts
- Resolved Seasonality percent chart
- Corrected MACD histogram overlap
- 60-minute charts/Schwab conflict resolved
- P/L Insight Graph includes up-to-date data
- Tradier Live Account Ticket credit/debit correction
- Staged Orders/Current Orders display consistency restored
- Screener – Score resulting in 0 candidates resolved