The Trade Journal is where the platform keeps the record of your trading — every position, when you opened and closed it, what you were thinking at the time, and how it turned out. This guide walks through it in order: finding your way around, recording and updating trades, keeping entries accurate, and reading what the Journal tells you about your results.
You can read straight through, or use the contents list to jump to what you need. Every section below is also a standalone article — the “Open as article” link under each one takes you to it on its own page, if you want to bookmark or share just that piece.
Getting oriented
Start here if you haven’t spent much time in the Journal yet. These pages cover what the Journal holds, how to move between its tabs, and how to choose which accounts you are looking at.
Symbol Journal
This is more than just documenting trades
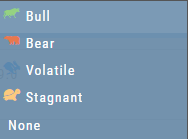
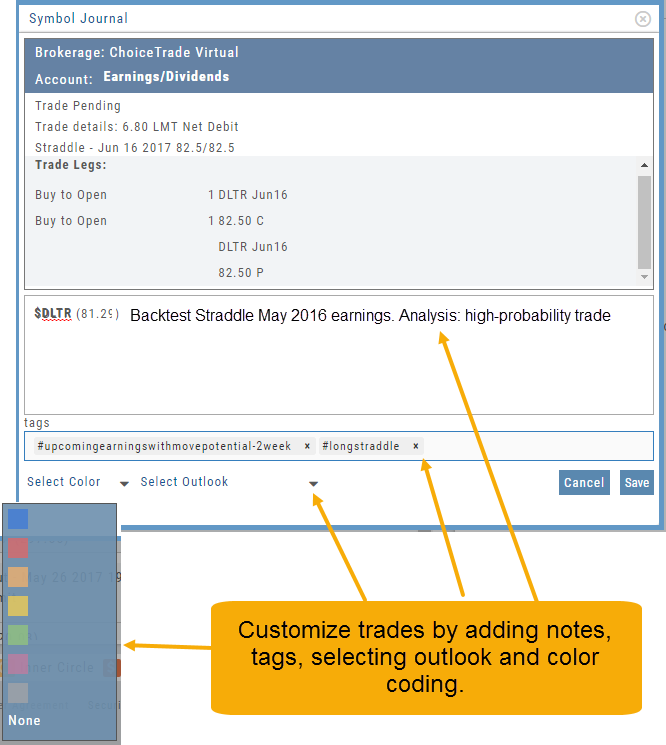
This Journal has benefits and features that allow you to truly customize a vital part of the trading process. Each trade allows you to: Make Notes, add Tags for organizational purposes as well as Color Tags you customize, Outlook icons further customize each trade entry.
Journal Navigation
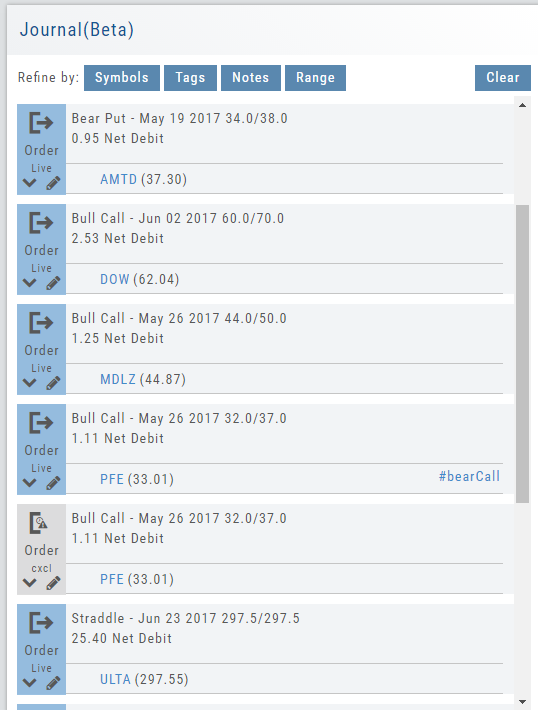
It’s easy to look up trades. Choose from Stock symbols, tags used (ex: #bullCall, #longStraddle), Notes containing certain words or phrases, or date ranges from 1 Day to 1 Year.

On the individual Trade tabs, click the  icon to expand the trade detail. To edit/add tags, notes, to the trade entry, click
  then ‘save’ when completed.
Once the Trade Tab is expanded, you have additional options: The “Replay” icon,  , sends a trade from the Journal to Backtest Analysis. You can delete a Journal Entry by clicking on
  .
.
Journal Account Multi-Selector
Reviewing your Journal Accounts is made easier by using the Multi-Select tool on the Journal Tab. Control your Journal Account Views by selecting from Live, Virtual, Manual accounts or Notes or any combination of these.
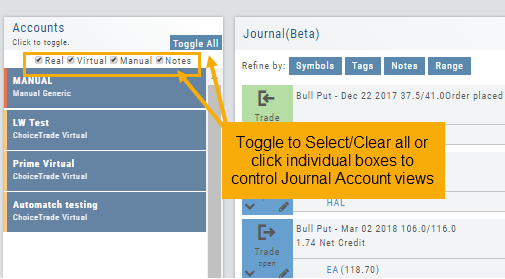
Use the “Toggle All” button to switch or toggle your selection. Example: If you have your virtual selected and not your real accounts, Toggle will switch to real account and unselect virtual account. This can be a great way to analyze your results and compare real and virtual.
You can further sort by Symbol, Tags, Notes or Date Range within an Account by using the following tabs in the Journal:

NOTE: Any filtering, including account selection, will refine your analytics results too. Want to find your results from a specific account? Select just that account and analytics will reflect accordingly.
Recording and updating your trades
Updating Journal Entries
Most of your day-to-day work in the Journal is adding to it — filling in notes, tags and outlook after a trade, linking related orders together, and removing entries you don’t need.
Updating closed or adjusted trades in the Journal Tab is easy by the following steps:
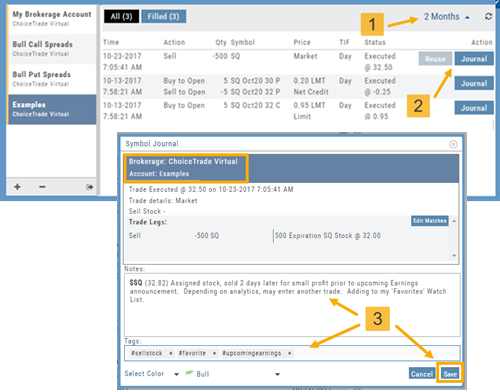
1. Go to the Order Status Tab, change the default “Today” in the upper-right area of the tab for previously executed trades.
2. Click “Journal” for the trade you want to update.
3. You can add Notes, #tags, outlook to be included in the Journal. Click “Save”. (Note the Account Name where this trade will appear)
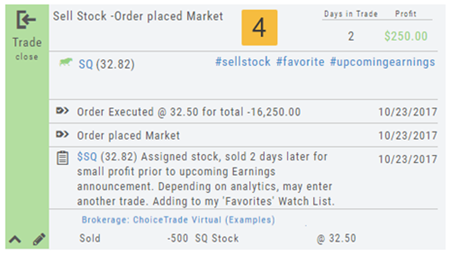
4. The trade is now updated in the Journal Tab. Expand the tab to see trade detail: Number of days in the trade, the profit (loss), order execution details, notes, tags, the Account Name containing the trade, etc.
The Analytics section will update using tags from these trades, further assisting in tracking progress in your trading.
Create Notes to Keep Organized
Notes are easily created throughout the Platform.
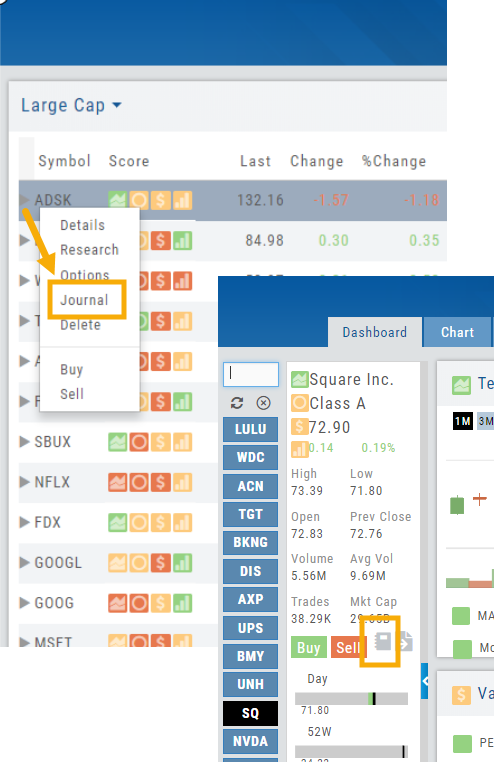
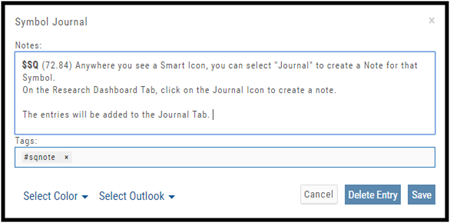
Anywhere you see a Smart (Action) Icon  , you can create a Note to be added to the Journal Tab.
Simply click on the icon and select “Journal” for the Symbol and current price to be captured.
The Research Tab also has a Journal Icon located on the Symbol Summary Box on the left side of the screen.
Use as a clipboard
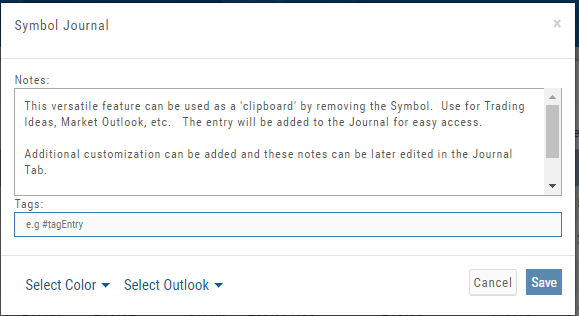
Notes can be used as a Clipboard to help you with your Trading system. Use it for Ideas, Market Conditions, even for Trading Education Classes.
Simply create a Note as previously indicated, then remove the $stock symbol and pricing information.
Now you have a Clipboard to keep customized notes.
You can further customize your Notes with your own tags. Read more about creating your own #tags
Notes can be edited at any time in the Journal Tab
Click on the ‘pencil icon’ to add or edit your notes, add #tags, outlook etc. For more info on adding tags: the #tags guide
Then click “Save“.
If you no longer need this note, simply click on the pencil icon, then “Delete Entry“
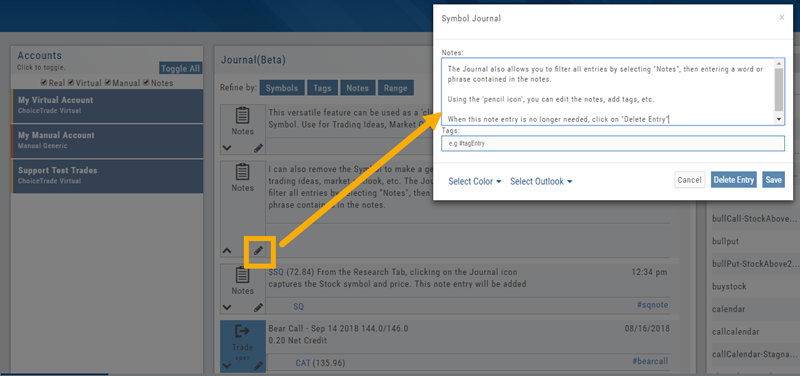
The Journal gives you the ability to view only Notes. On the left panel of the Journal Tab, select “Notes” from the Account Selector.
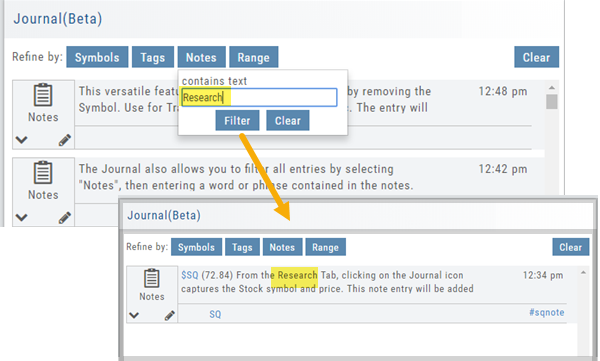
You are further able to refine your search by specifying text contained in the Notes. Select “Notes” in the middle panel of the Journal, then type in text that would appear in the Note entry. Click on “Filter”.
When finished, click “Clear“.
Add New #tags and Auto-Tagging
Trade Finder Scans have #tags that will automatically appear on the corresponding trade tabs in the Journal, such as #BullCall, #BullPut or #CoveredCall, for example. Trades built manually will default to #custom. In addition, trades that have expired will be auto-tagged: #expiration.
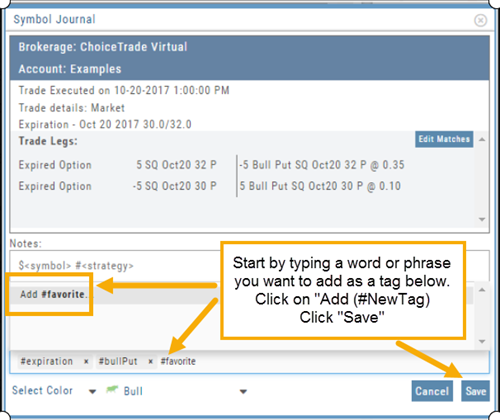
You can revise these tags and/or add your own, by the following steps:
1. On the Journal Tab, select the Trade entry you wish to edit by clicking on the Pencil Icon.
2. In the Tags section (lower part of box), start typing the word/phrase you wish to use. Example: favorite
(It is not necessary to enter the ‘#’ symbol first).
3. Click on “Add (#NewTag)“, then Save.
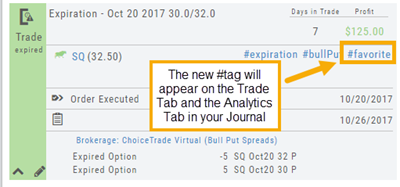
4. The new Tag will be on the individual Trade tab and the Analytics section of the Journal.
Journal Tagging – OCO, Trailing Stops, etc.
OCO Journal Tagging
OCO Orders are automatically tagged in the Journal.
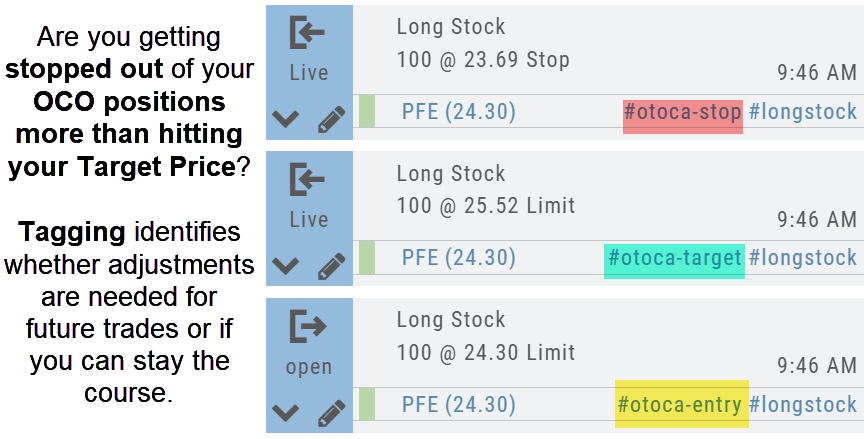
Once the Stock Order is Executed (it is an active Position), the Limit and Stop orders are Live (active Orders for the duration selected: Day or GTC.)
If/when the stock hits the Limit price, that order will execute, and the Stop order will be canceled. The Journal tab will be green and display a Gain/Profit.
-OR-
If/when the stock hits the Stop price, that order will execute and the Limit order will be canceled. The Journal tab will be red and display a Loss.
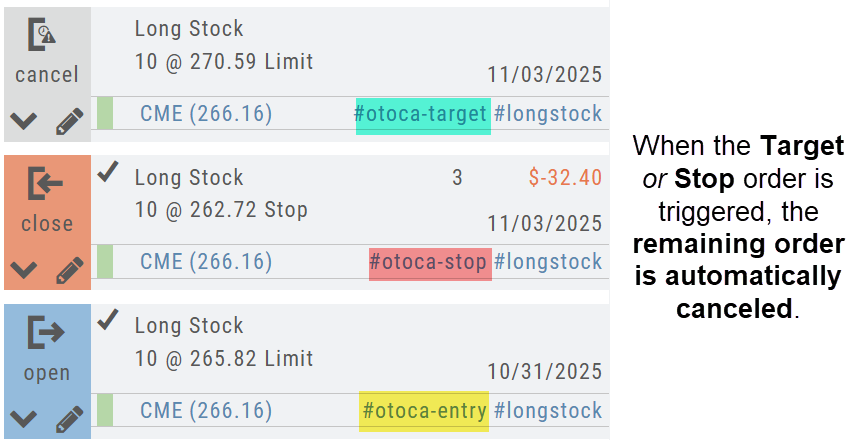
The tagged results show whether you’ve been hitting your target or getting stopped out.
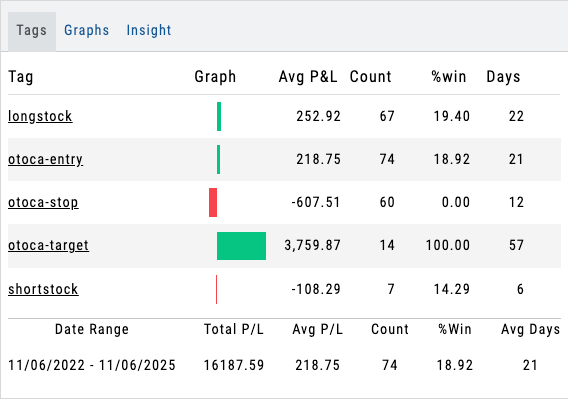
**Note: Past Conditional trades will be tagged as “otoca-entry”, “otoca-target” and “otoca-stop”.
Link Trades in Journal
Trades can easily be linked in the Journal. This is helpful to keep related trades grouped together for easier tracking and analysis.
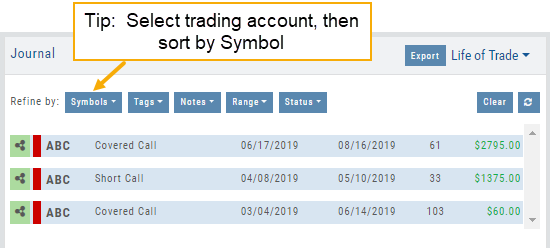
Some common applications include:
- Covered Calls – keeping stock and selling Calls with different Expirations
- Adjustment/Repair Trades
- Other previously Unmatched trades
This feature is best used in the Life of Trade View in the Journal.
The following steps will allow you to Link Trades: 
1. After selecting your account and sorting by symbol, expand one of the trade tabs you want to link to another trade group or set.
Click the ‘Link Icon‘
2. A pop-up window will list the Selected (Expanded) Trade, any related trade and Available Trade Sets for that symbol in that account.
Note: You can link trade sets both prior to and following your current, selected trade.
Example: You want to link a May 2019 expired Call to April 2019 and June 2019 Covered Call trade set.
3. Click “Link To This Trade Set” for trade set(s) to link selected trade to, then click “Close“.
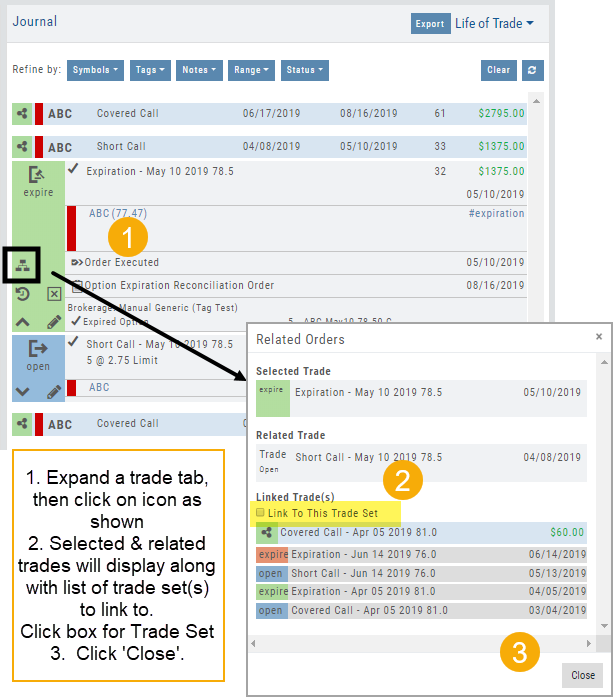
In this example, we linked an Expired May 10 2019 short call to an April and June Covered Call trade set.
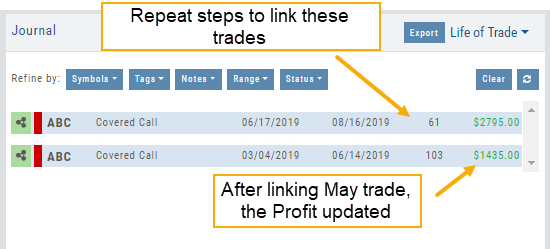
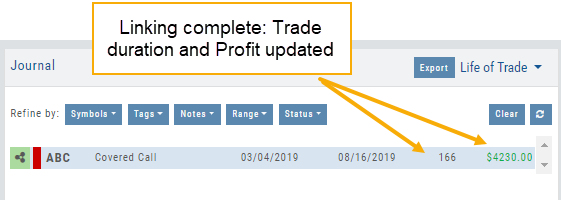
After linking the trade, notice the total Profit (Loss) Amount updated, but the trade duration did not.
This is because the May Call falls in between the original April trade entry and the June expiration.
If you have more trade sets to link, repeat the previous steps as outlined.
Final note: If you link a trade in error, simply expand the same trade tab and ‘uncheck’ the Link This Trade Set box.
Delete Journal Entries
Whether you entered a trade incorrectly, or want to remove Cancelled Orders from your Virtual or Manual Account, you have the ability to delete a Journal Entry.
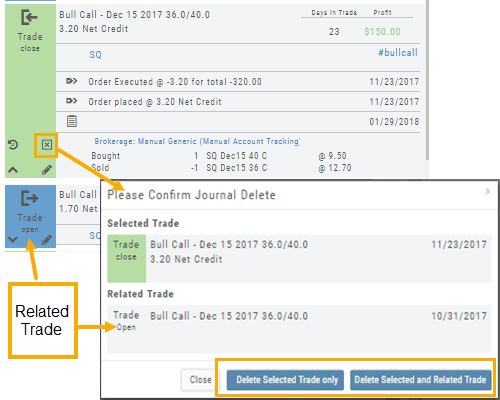
Simply expand the Trade tab and click on the  icon.
icon.
If you are deleting Cancelled or Expired orders, you’ll be prompted to confirm you want to delete the entry.
For trades that have a specific Open and/or a specific Close, you’ll be prompted to choose either Selected Trade or Selected and Related Trade, if applicable.
Prior to deleting your selection, you’ll be prompted to confirm the action. Once deleted, the trade cannot be restored.
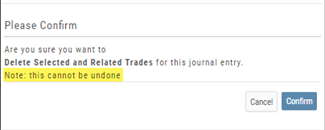
Note: Deleting a Journal entry for a Manual Account will remove the trade completely from both the Journal and Manual Account.
Deleting a Journal entry for Real or Virtual Accounts only remove the Journal entry, and the trade will remain in the account.
Automatic Account Syncing – Up to 2 Months
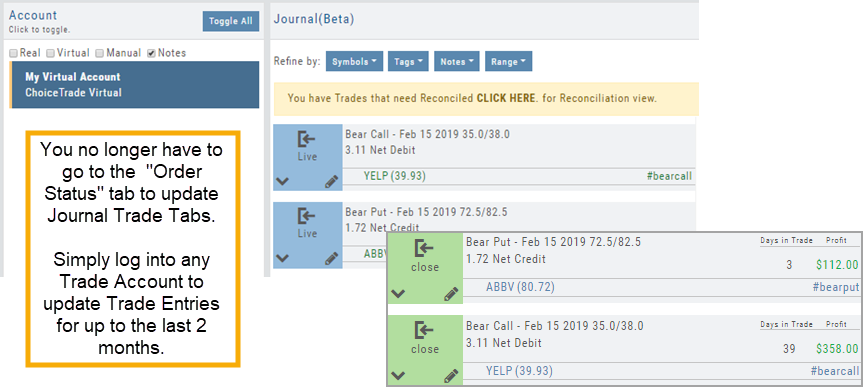
When you add your brokerage account to the platform, make sure to select the ‘Auto-Journal’ Feature enabled. By doing so, the system will automatically insert orders/trades from the last two months into the platform’s Journal.
After the brokerage is added, any trade executed on your brokerage website instead of through the platform portfolio will also be captured in the two-month time period.
Finally, there is no need to go to an account’s Order Status tab to update Journal Trade Tabs. Simply log in to the account from the Account Summary Tab. Trade tabs will automatically update for the last 2 months!
Keeping the Journal accurate
The Journal fills itself in from your account activity, but expired and adjusted positions sometimes need a hand. Reconciling is how you tell the platform how those trades actually ended.
Journal Auto-Reconcile
Journal Auto-Reconcile
The auto-reconciliation in the Trade Journal aligns trades and results—allowing students to focus on analyzing performance instead of managing data. Since consistent review is key to improving as a trader, this streamlines the learning process.
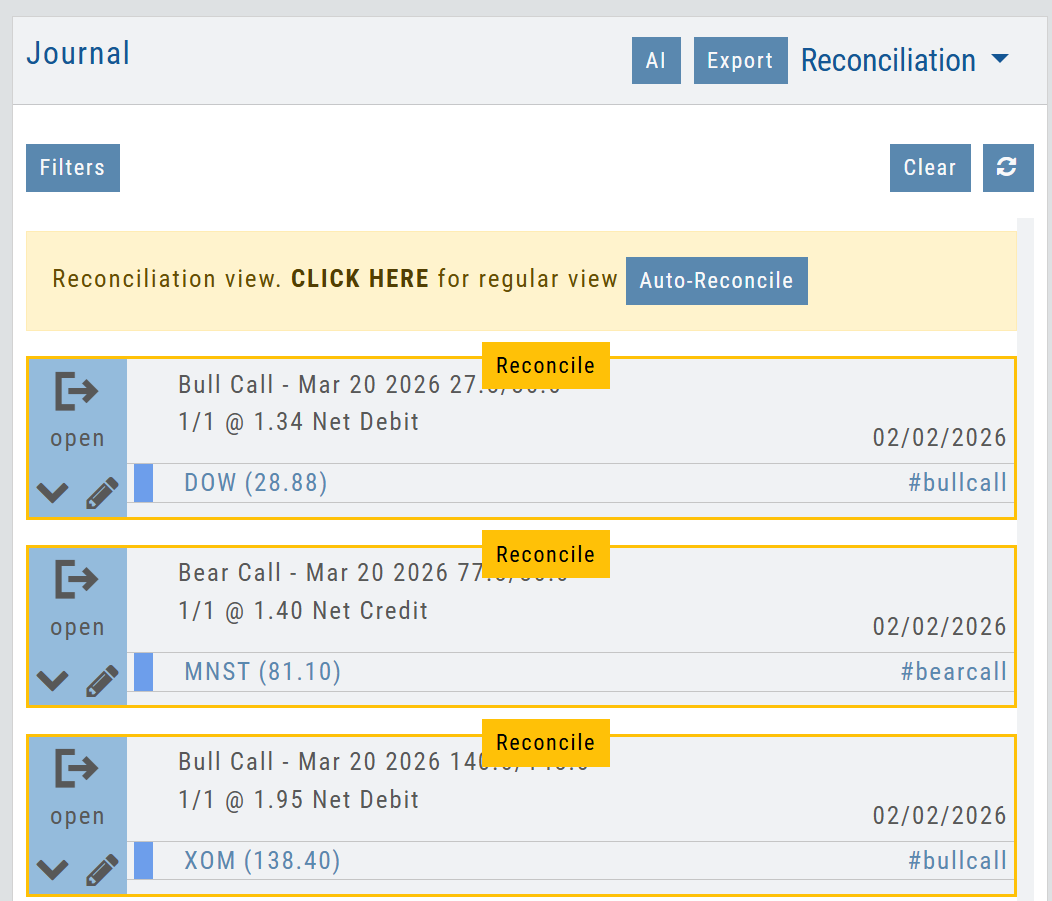
Start in the Reconcile View of the Journal:
Next, click the  button.
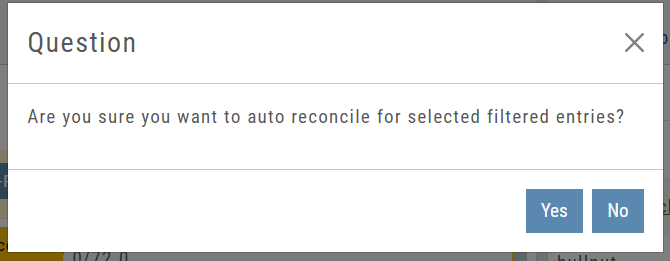
The dialog box to the left will appear:
Click “Yes”
The display will list the resulting action for each expiration.
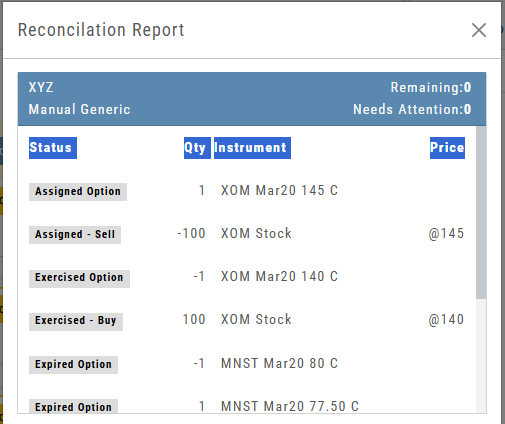
You can scroll to review.
The arrow icon appears on Journal Tabs that can be edited. 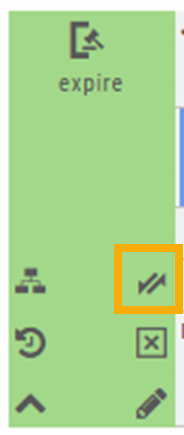
Click on the icon, confirm you want to make changes.
When completed, “Save”
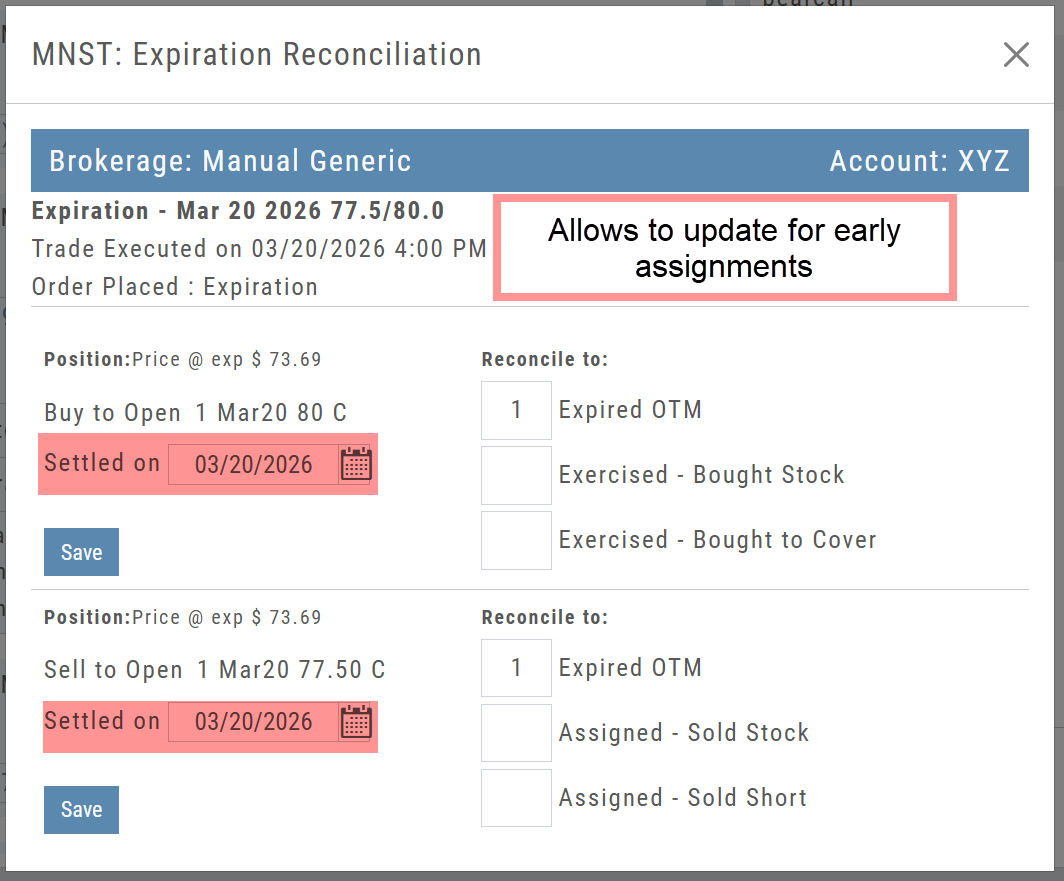
The display will list the resulting action for each expiration.
You can scroll to review.
Reconcile Trade Notice
The Tags including the P/L Summary, Graph and new Insight tabs rely on updated Journal entries which includes reconciled trades.
The following notice appears in the Journal when trades need to be reconciled:

All trades in the trading account(s) selected will display with the option to change back to Regular View:
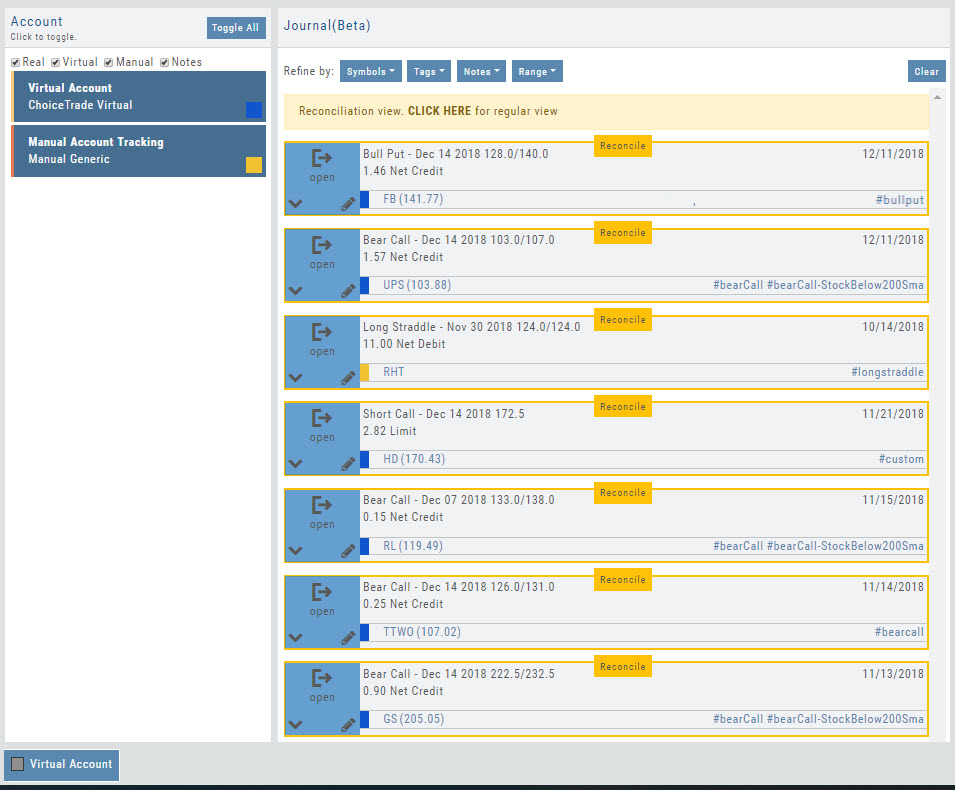
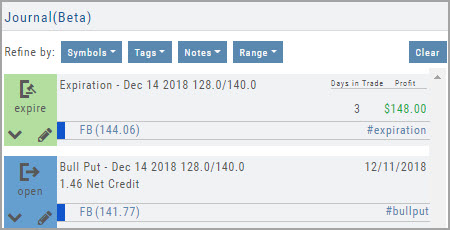
Individual trades are reconciled by clicking on the “Reconcile” tab outlining the Journal Entry.
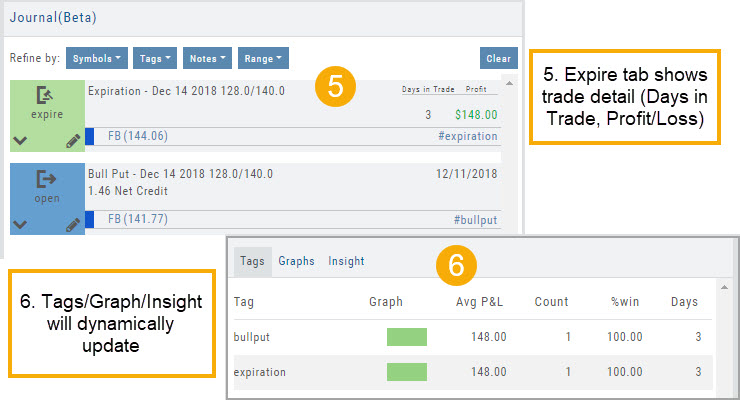
The Journal Tab will update showing the trade had a profit/loss or adjustment in the underlying.
More info on updating Journal Entries
Updating Journal Entries
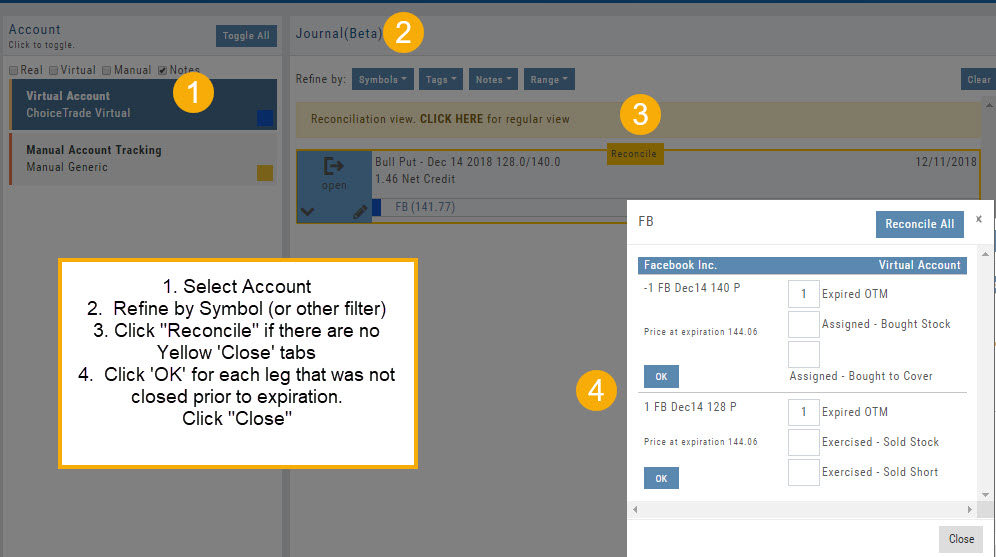
Logging into your account will update Journal entries for up to the last two months. However, trades that expired will need to be Reconciled. If the system is unable to match trades, a Yellow ‘Close’ tab will result, requiring manual action to close.
Follow the steps as shown below to reconcile your trades.
Note: Step 2 is not required, however, if you are just learning to use the Journal and its features, sorting by Symbol, especially if you have multiple trades, simplifies the process.
Journal – Color Tagging
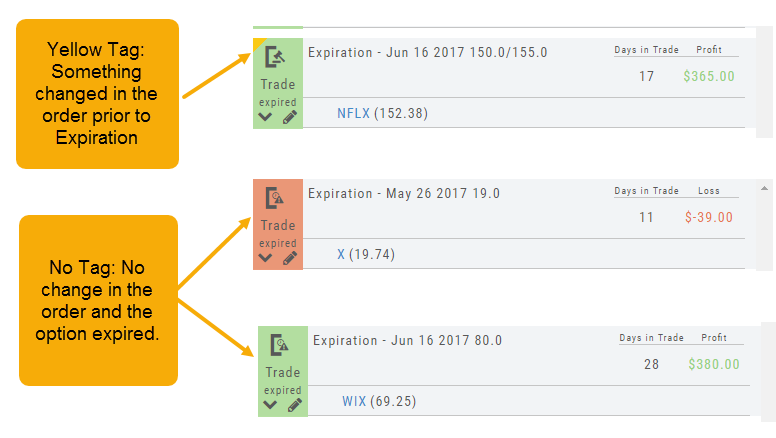
After Reconciling your closed trades, click “OK” to have the Journal entries updated.
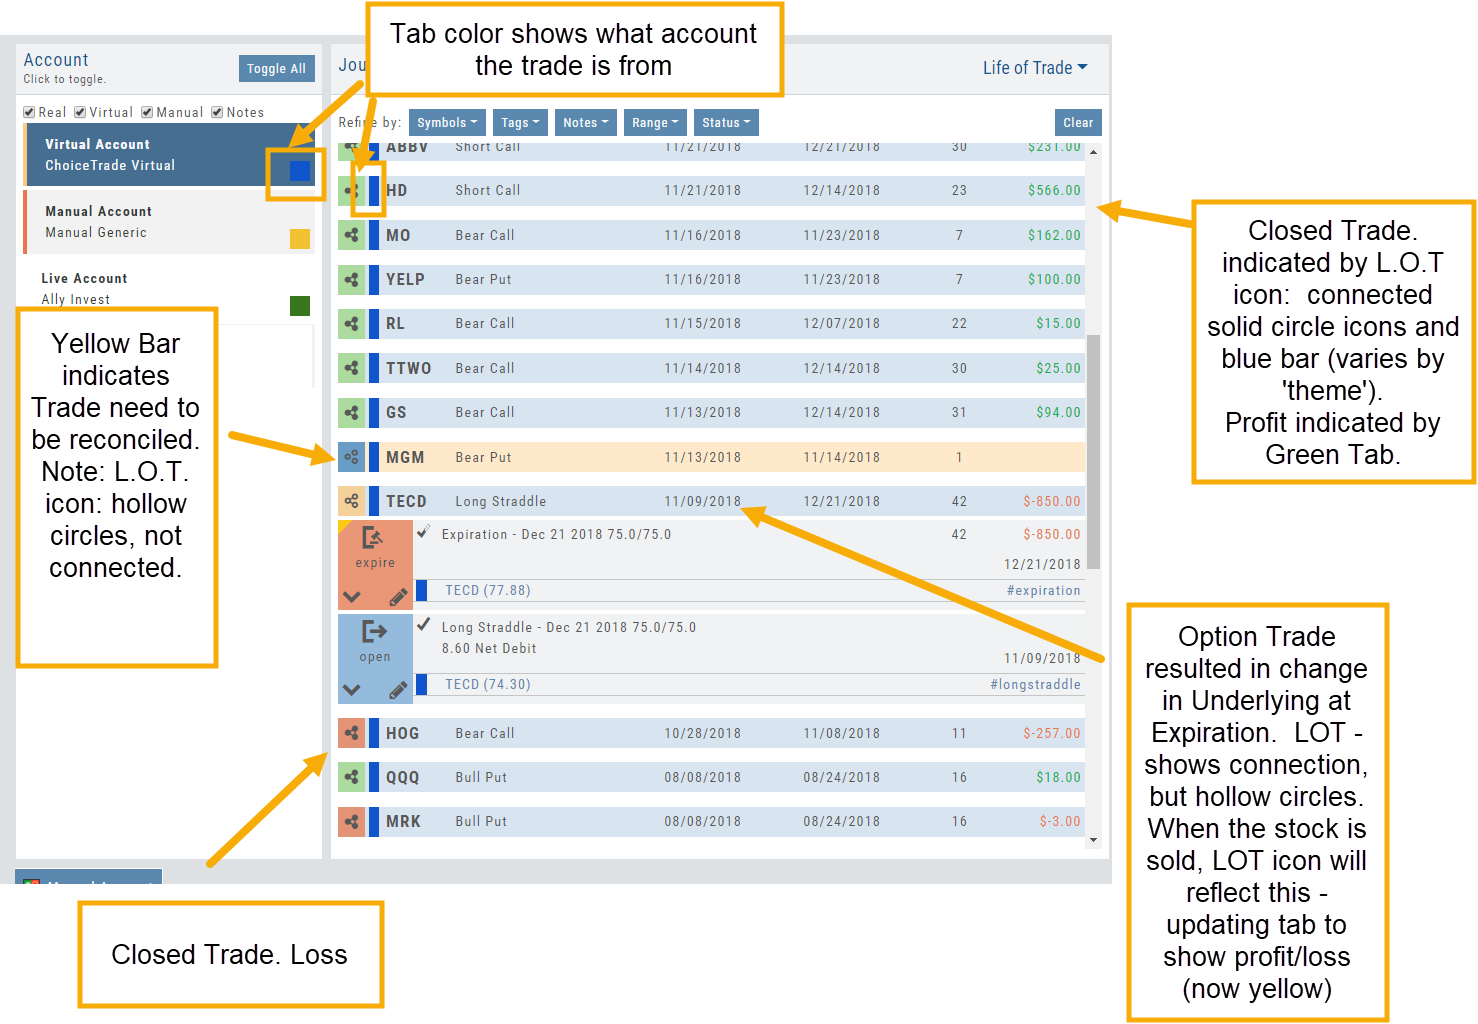
Yellow tag: There was a change in the Option position. For example, an option was exercised before expiration – or the order was adjusted.
No tag: There was no change and the Option expired worthless.
Green Tab: Profitable trade
Red Tab: Losing trade
Reading a trade at a glance
Life of Trade Journal View
Once a trade is in the Journal, its colors and icons tell you where it stands without opening anything.
Life Of The Trade
“Life of Trade” View in the Journal offers another way to view your trading activity and results.
Trades are grouped by Symbol, making it easier to follow the trade from Open-Adjust-Close – along with any Assigning/Exercising of the underlying stock.
This view further allows you to sort by Account, Symbol, etc for more targeted analysis.
Refine Journal Entries by ‘Status’
‘Status’ provides an additional avenue to refine your Journal updating and analysis in the Life of Trade view.
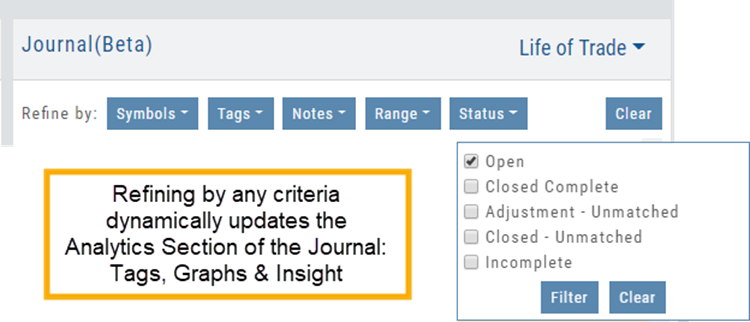
- Open – current, active trades without prior change in underlying. Identified by Blue Tab.
- Closed Complete – all legs of trade, including any adjustments or change of underlying, have been closed and matched. Identified by Green or Red tab (Profit or Loss).
- Adjustment – Unmatched – the original trade has been adjusted, but the changes have not been reconciled. This entry will be identified by a Yellow tab.
- Closed – Unmatched – the original trade, including adjustments and change of underlying are closed, but one or more components of the trade need to be matched. Identified by yellow tab.
- Incomplete – the original trade resulted in change in the underlying stock being Assigned or Exercised.
Journal – Trade Results
Trade Details
The Journal allows you to view your trade results, including a visual outline of the position from Open to Close, including any Adjustments and Expirations.
Start in the Life of Trade view.
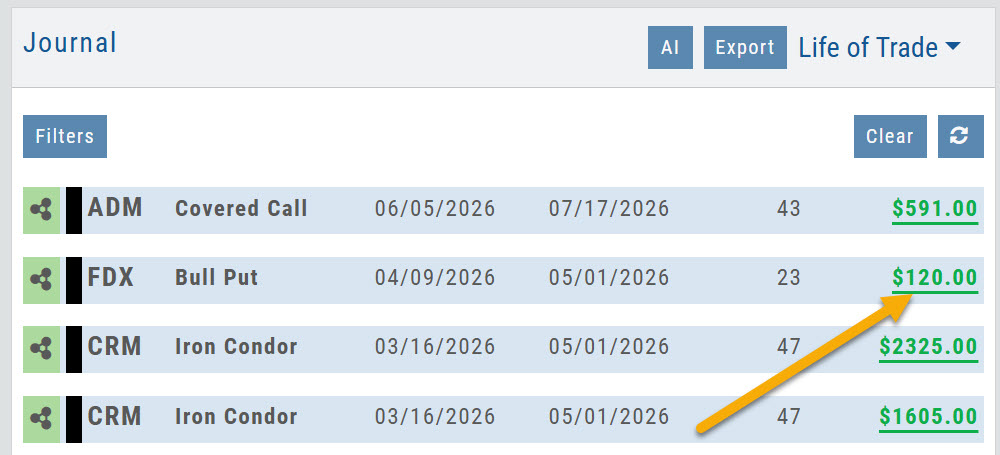
Click on the Gain/Loss value on the far right of the trade entry
Stock Journal Entry
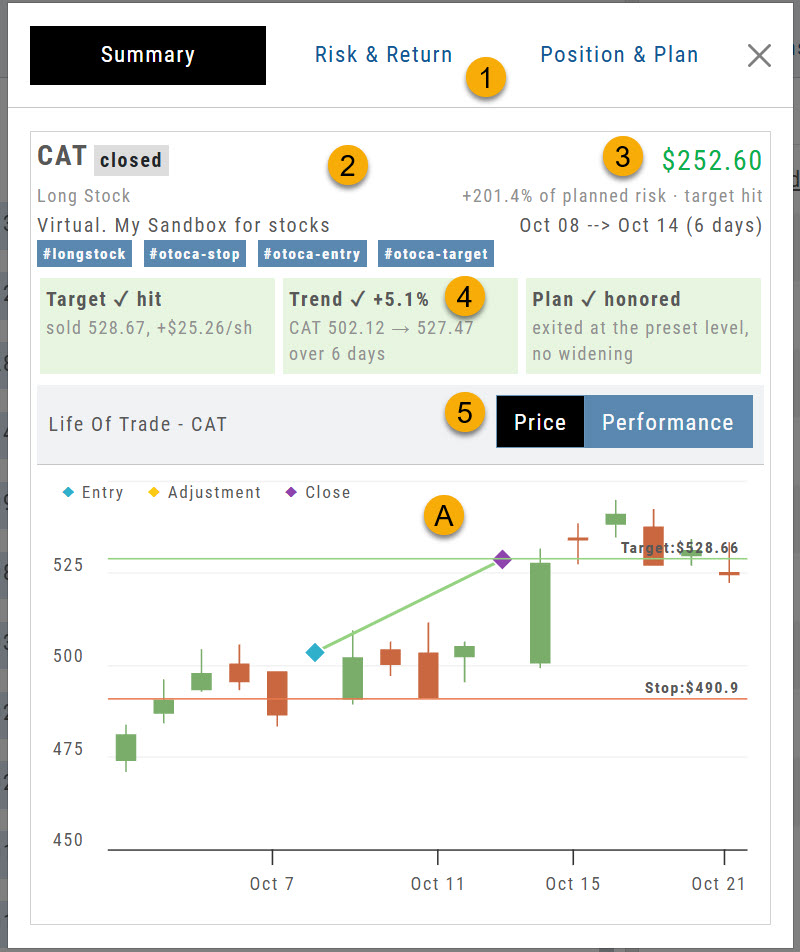
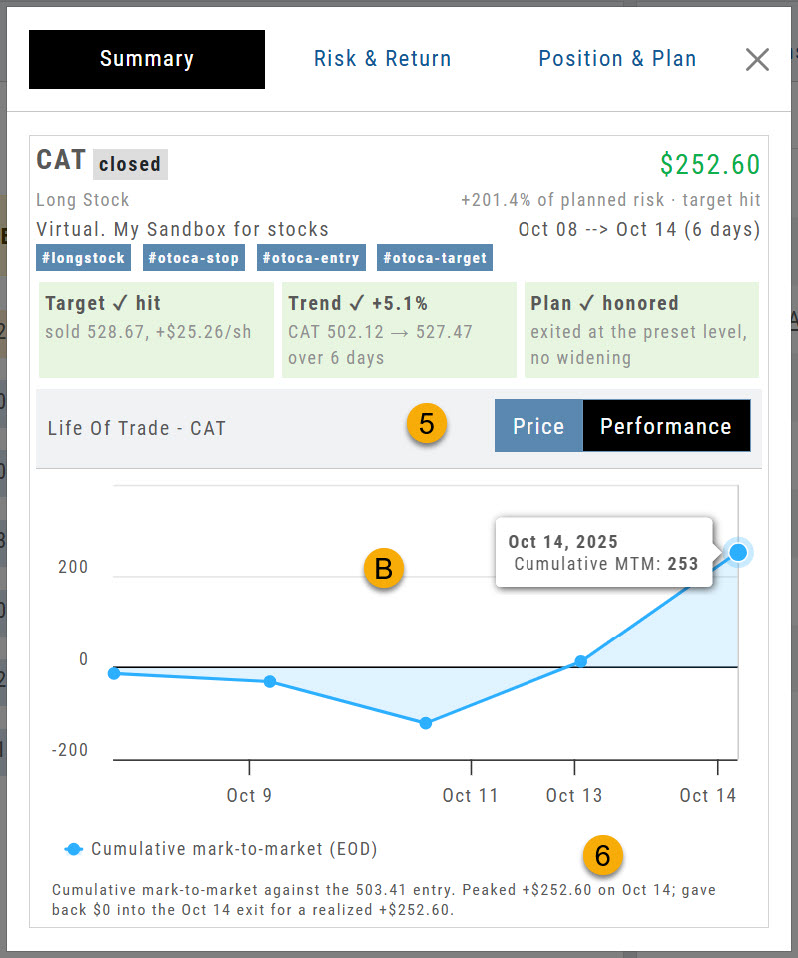
- Overview Tabs: Summary, Risk/Return, Position & Plan
- Trade Summary: Symbol, Trade Status, Position, Account & Tags
- Results: Profit/Loss, % of Target, Duration of Trade
- Evaluation: Color represents a contributing or detracting factor in the trade
- Price/Performance
A. Candlestick chart with position entry/adjustment/close – and OCO Stop/Limit, if applicable.
B. Cumulative activity for trade duration - Summary of Performance
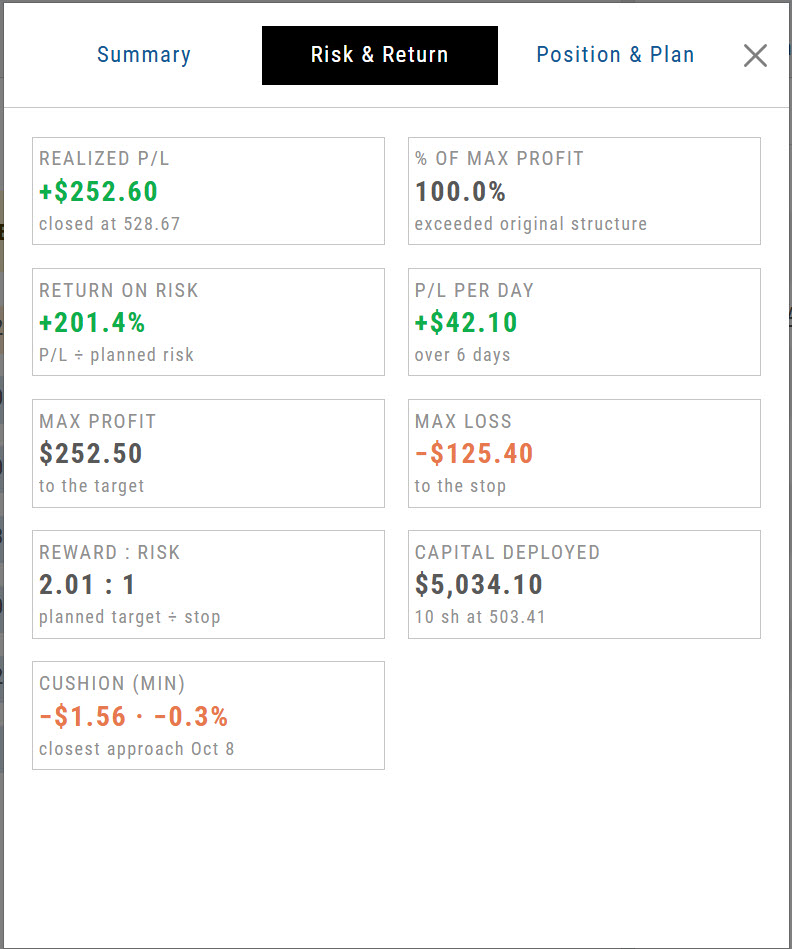
The Risk & Return Tab outlines the trade results.
In this bracket order example:
10 shares were purchased at a lower entry price ($503.41) than the order price of $503.44.
6 days later, the Target of $528.66 was reached, and the close order was executed at $528.67
The Stop Order ($490.90) was cancelled automatically.
The original plan outlined a 2.01 Reward:Risk ratio. Due to the lower entry price and higher close price, the result was a slightly higher R/R of 2.02.
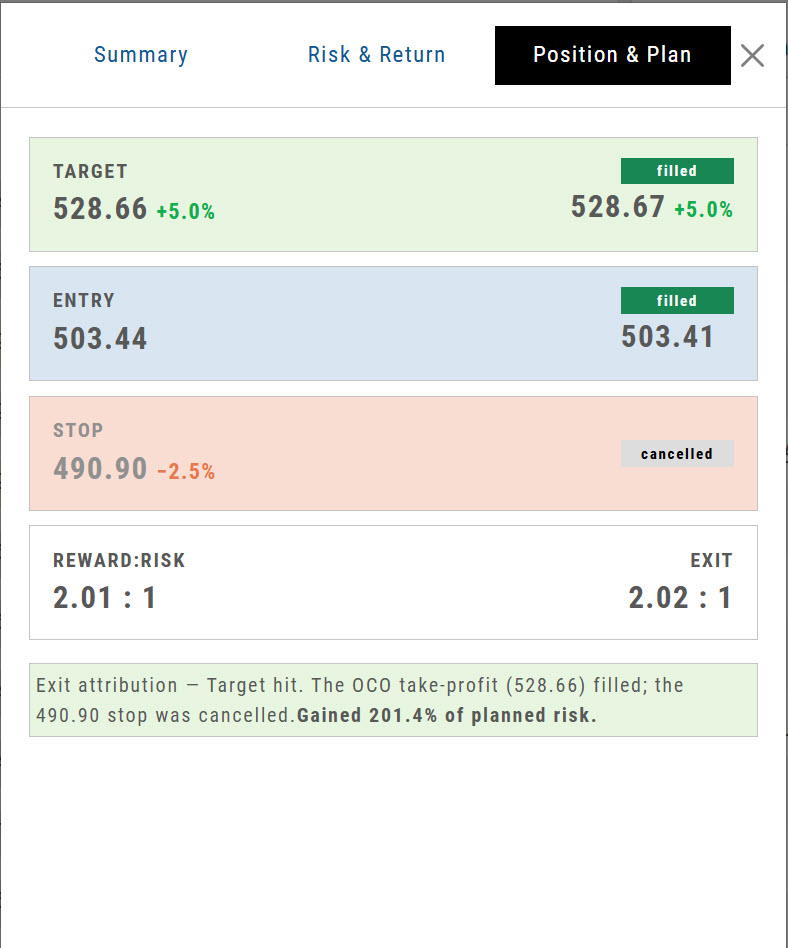
The Position and Plan tab offers a breakdown of the trade results.
In this example, the stock trade was executed at a better price and reached its target price to close, which was also at a better price. The Stop order was cancelled.
The result shows a slightly better than expected Reward: Risk ratio
Option Journal Entry
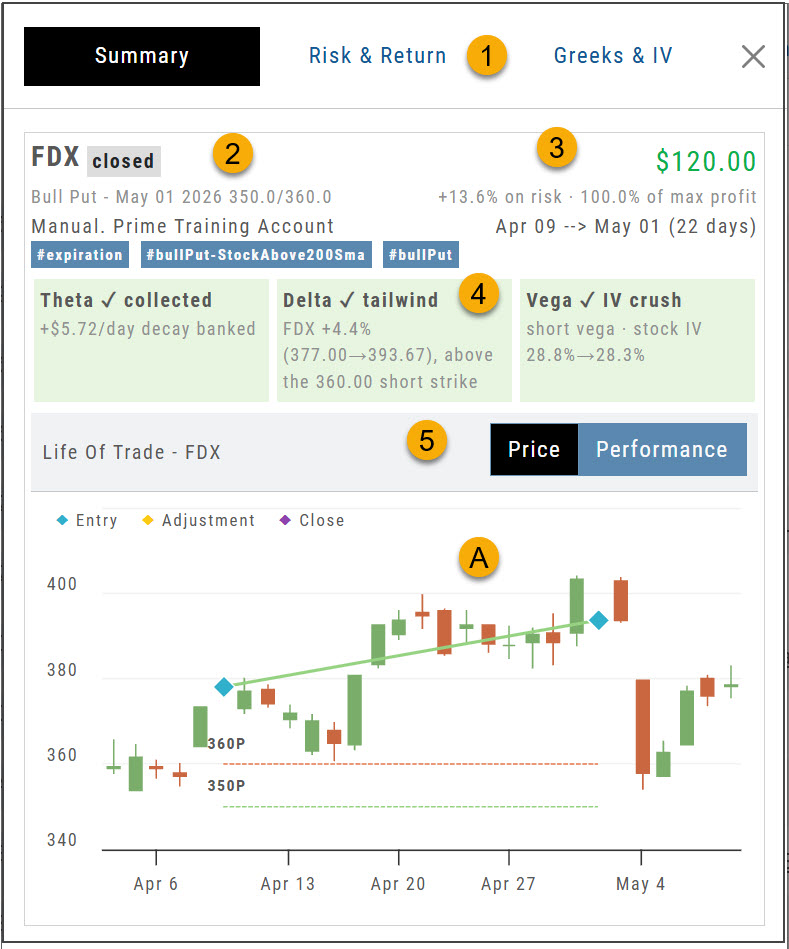
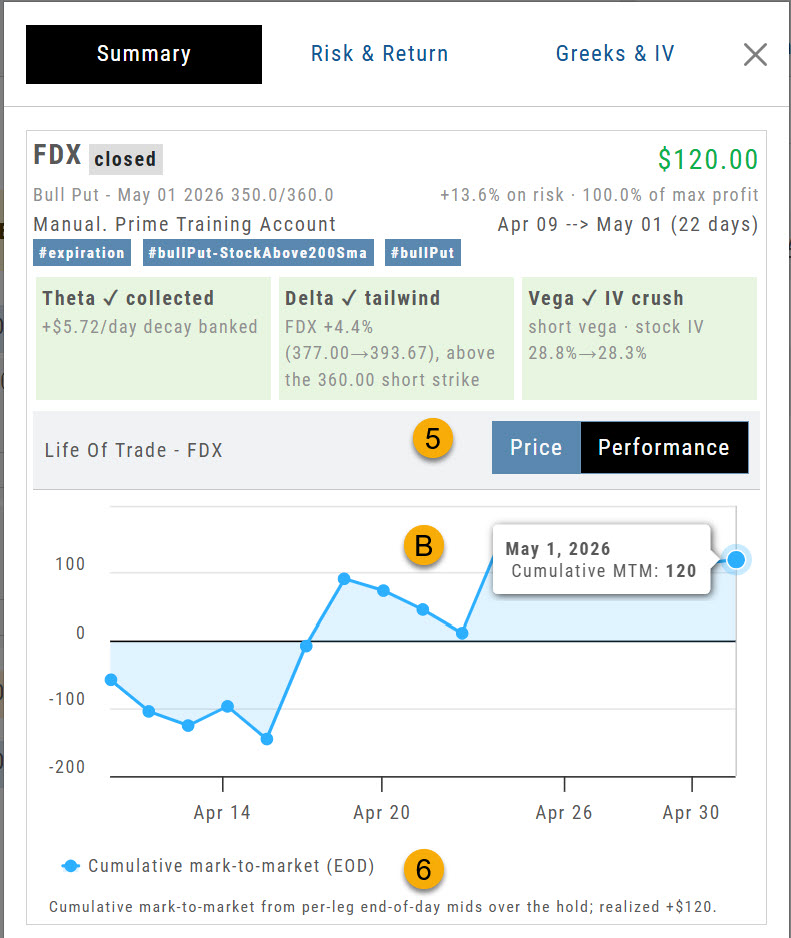
- Overview Tabs: Summary, Risk/Return, Greeks & IV
- Trade Summary: Symbol, Trade Status, Position, Account & Tags
- Results: Profit/Loss, % of Target, Duration of Trade
- Evaluation: Up to 3 Primary Drivers of the Trade
- Price/Performance
A. Candlestick chart with position entry/adjustment/close
B. Cumulative activity for trade duration - Summary of Performance
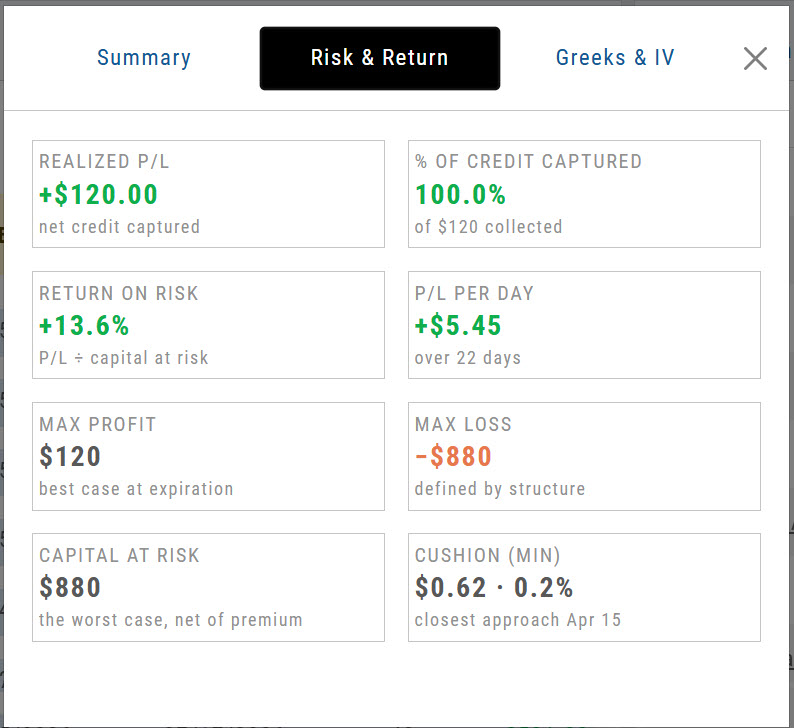
The Risk & Reward Tab summarizes the trade outline and result.
In this example:
The $10 Bull Put Spread resulted in Max Profit of $120 and Max Risk of $880
Duration: 22 days; profit per day: $5.45 ($120/22)
Return on Risk: 13.6% (120/880)
Cushion: How much below the break-even point the trade reached
 .62″ class=”wp-image-1252″ width=”400″ style=”width:400px;height:auto”/>
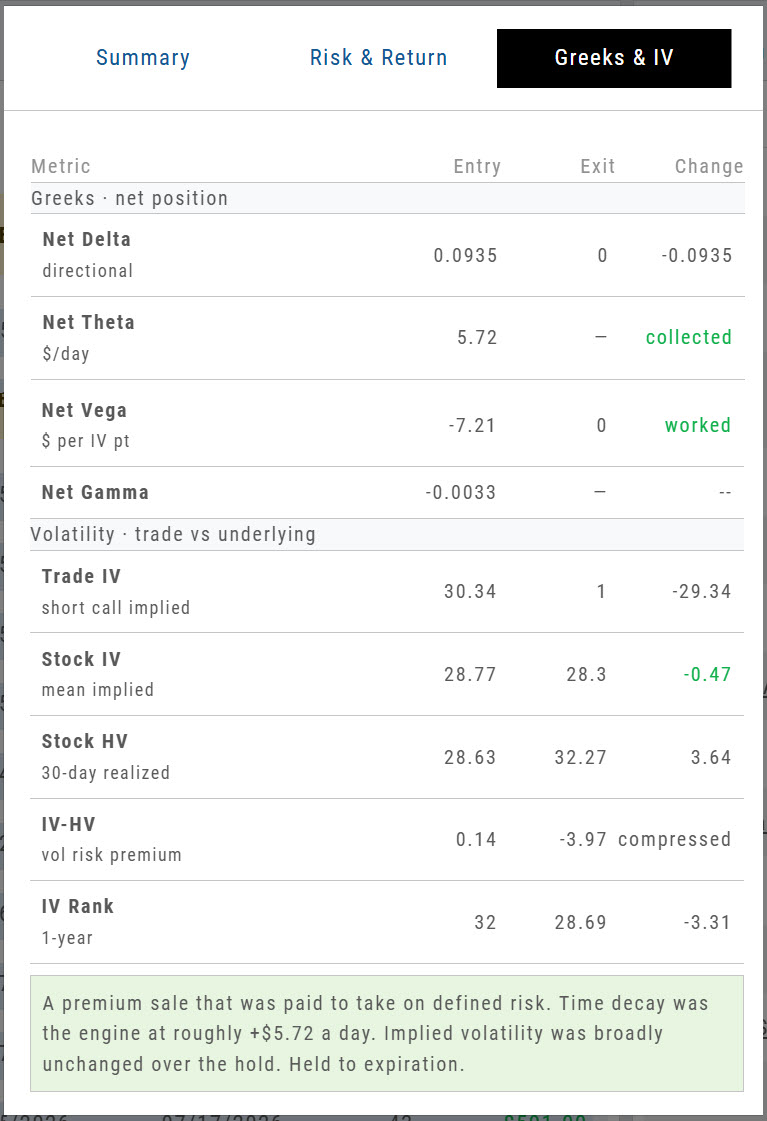
Greeks & IV Explained
| Metric | What it tells you | Change column shows |
|---|---|---|
| Net Delta | Directional exposure — roughly what the position gains or loses per $1 move in the stock | Signed number |
| Net Theta | $/day — premium the position collects (+) or pays (−) each day it’s held | collected / paid |
| Net Vega | $ per IV point — what the position gains or loses per 1-point change in implied volatility | worked / hurt / faded |
| Net Gamma | How fast Delta itself moves as the stock moves — negative for credit spreads and short premium | Signed number |
| Trade IV | The implied volatility of your own legs — what you actually sold or bought | Signed number |
| Stock IV | The underlying’s mean implied volatility, with HV (30-day historical) shown beneath it | Signed number |
| IV − HV | Volatility risk premium — how far implied sat above (or below) what the stock has actually been doing | Signed number |
| IV Rank | Where implied volatility sat in its own 1-year range, 0–100 | Signed number |
Greeks & IV Tab Explanation
Greeks & IV Explained
The Greeks & IV tab helps you understand why an options trade performed the way it did.
Instead of showing Greeks only when you enter a trade, the Journal compares them at Entry and Exit. Think of it as a before-and-after view of your trade.
Net Delta — Direction
Delta shows how sensitive your position was to movement in the underlying stock.
- Positive Delta benefits from an upward move.
- Negative Delta benefits from a downward move.
- A move toward zero generally means directional exposure decreased.
Comparing Entry to Exit helps show whether stock movement became more or less important as the trade progressed.
Net Theta — Time Decay
Theta estimates how much the position gains or loses from the passage of time each day.
- Premium-selling strategies generally benefit from positive Theta.
- Premium-buying strategies generally pay Theta as time passes.
Rather than showing only how the daily Theta rate changed, the Journal identifies whether time decay was collected or paid during the trade.
Net Vega — Implied Volatility
Vega measures how changes in implied volatility affected the position.
- Long options generally benefit when IV rises.
- Short-premium positions generally benefit when IV falls.
The Journal summarizes whether volatility:
- Worked in your favor
- Hurt the trade
- Faded as the position approached expiration or lost remaining premium
Net Gamma — Delta Sensitivity
Gamma measures how quickly Delta can change as the underlying moves.
Higher Gamma means your directional exposure can change more quickly, particularly as expiration approaches.
For most trade reviews, Gamma provides additional context about how sensitive the position became to price movement.
Understanding Volatility
Trade IV
Trade IV is the implied volatility associated with the option contracts in your trade.
It reflects the volatility being priced into the specific strikes you bought or sold.
Stock IV
Stock IV represents the broader implied volatility of the underlying stock.
Comparing Trade IV with Stock IV can help show whether your specific options were priced with more or less volatility than the stock’s overall option market.
Stock HV
Historical Volatility (HV) measures how much the stock actually moved over the previous 30 days.
Think of it this way:
IV = expected volatility
HV = actual recent volatility
IV − HV
IV − HV compares the volatility the options market was pricing with the volatility the stock actually experienced.
- Positive: IV was higher than HV.
- Negative: HV was higher than IV.
For premium sellers, a positive difference can indicate that options were pricing in more movement than the stock had recently been delivering.
IV Rank
IV Rank shows where the stock’s current implied volatility falls within its own 1-year range, from 0 to 100.
- A higher IV Rank means volatility is relatively high for that stock.
- A lower IV Rank means volatility is relatively low.
This gives IV some context. A 30% IV may be high for one stock and low for another.
Reading the Results
The Change column helps you quickly see what happened between Entry and Exit.
Some rows show a numeric change, while Theta and Vega use words such as collected, paid, worked, hurt, or faded to make the result easier to interpret.
Colors provide another quick reference:
- Green — helped the trade
- Red — hurt the trade
- Gray — neutral or informational
A negative number is not automatically bad. For example, Delta moving closer to zero may be favorable for a short-premium trade.
Putting It All Together
When reviewing the Greeks & IV tab, ask yourself:
Did price movement help or hurt?
Look at Delta.
Did time work for or against me?
Look at Theta.
Did changes in volatility help or hurt?
Look at Vega and Trade IV.
Was volatility relatively high or low when I entered?
Look at IV Rank and IV − HV.
Taken together, these numbers help answer the most important question:
Did the trade work for the reason I expected it to?
Understanding your results
This is the part of the Journal that pays you back for keeping it up. Insight, Analytics, the summary tables and the graphs all read from the trades, tags and notes you have entered, and together they answer which of your strategies is actually working.
Insight Tab in Journal
The Insight Tab, along with Tags and Graphs update dynamically with the account(s), symbol(s), tag(s) and/or date range selected.
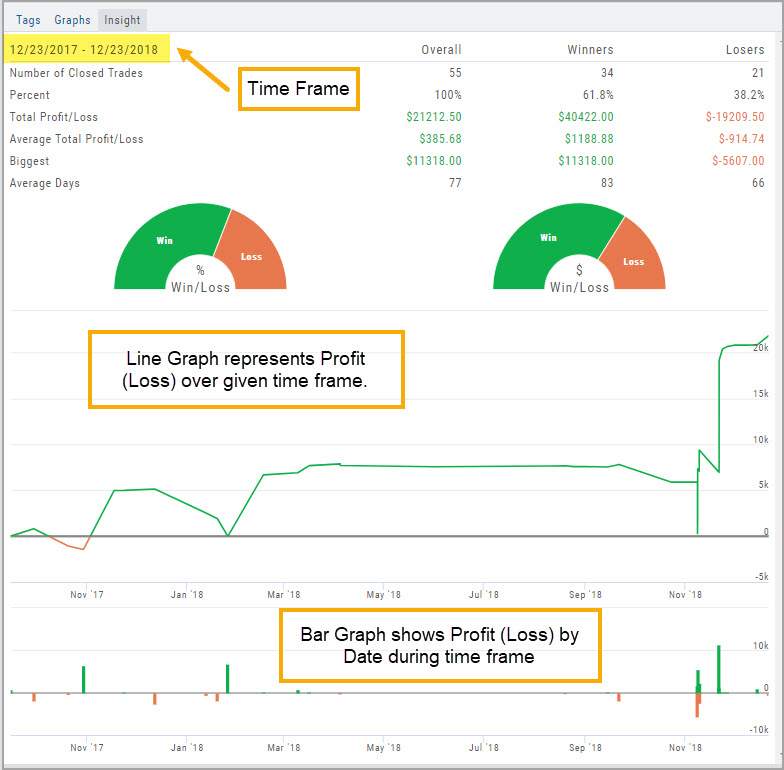
Insight breaks down Overall Performance by Winning and Losing trades in addition to:
- Number of closed trades
- Percent (Winning/Losing Trades)
- Total $ Profit/Loss
- Average Total Profit/Loss
- Biggest (Winning/Losing Trade)
- Average Days in Trade
Journal Tag Analytics
Want to know how effective your trading strategies and practices are? This is where you’ll get your answers.
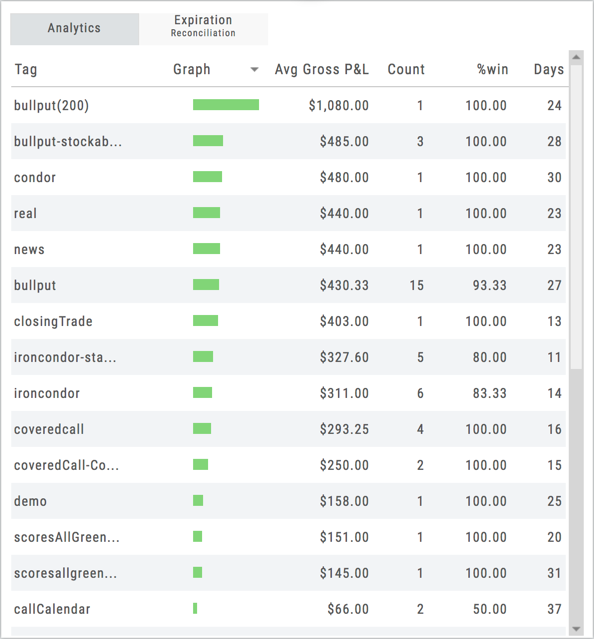
Get visual feedback broken down by strategies and analytical data including a Profit Graph, Average Gross P&L, the frequency of each strategy executed, % Win Ratio, Number of Days in a Trade.
Journal Analytics is a powerful tool to reinforce consistency in the practice of the trading process- from the overview, evaluation, research, execution and exiting. Journaling identifies what works, what needs more discipline, etc. Analytics provide this information in easy-to-read data.
Tag Results-Table Summary Totals
Located below the Analytics Tab in the Journal, the Tag Result Table Summary displays trade performance by Date Range, Total P/L, Average P/L, Number of Trades (Count), % Profitable and Average Number of Days in Trades.

This data is dynamically updated by available filters including:
Type of account(s) (Manual, Virtual &/or Live)
Specific trading account(s)
Date Range
Stock symbol
Tags
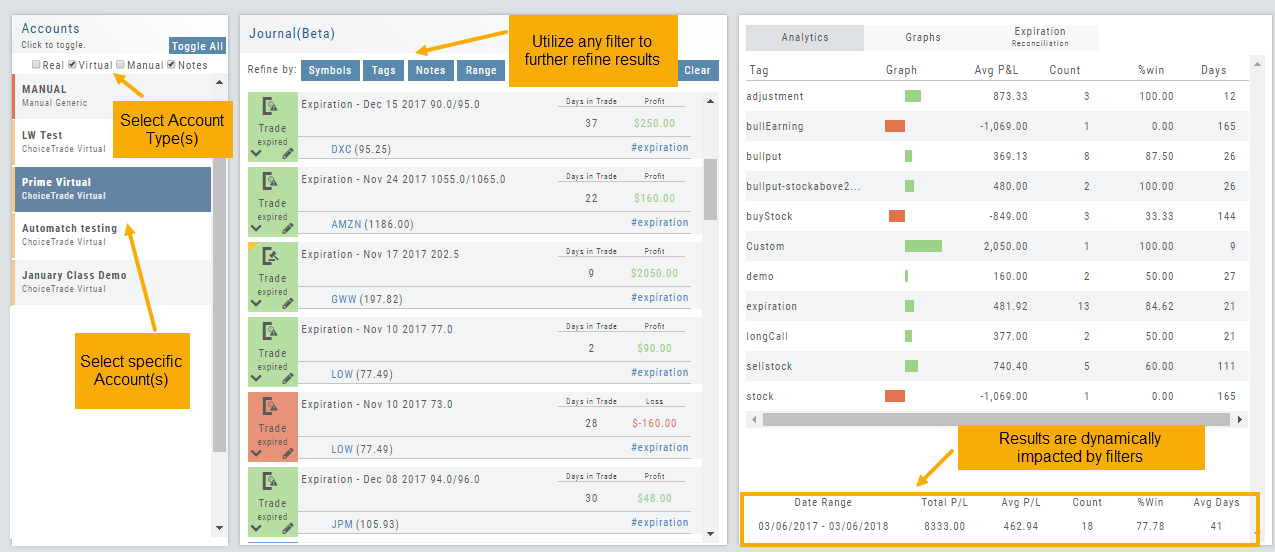
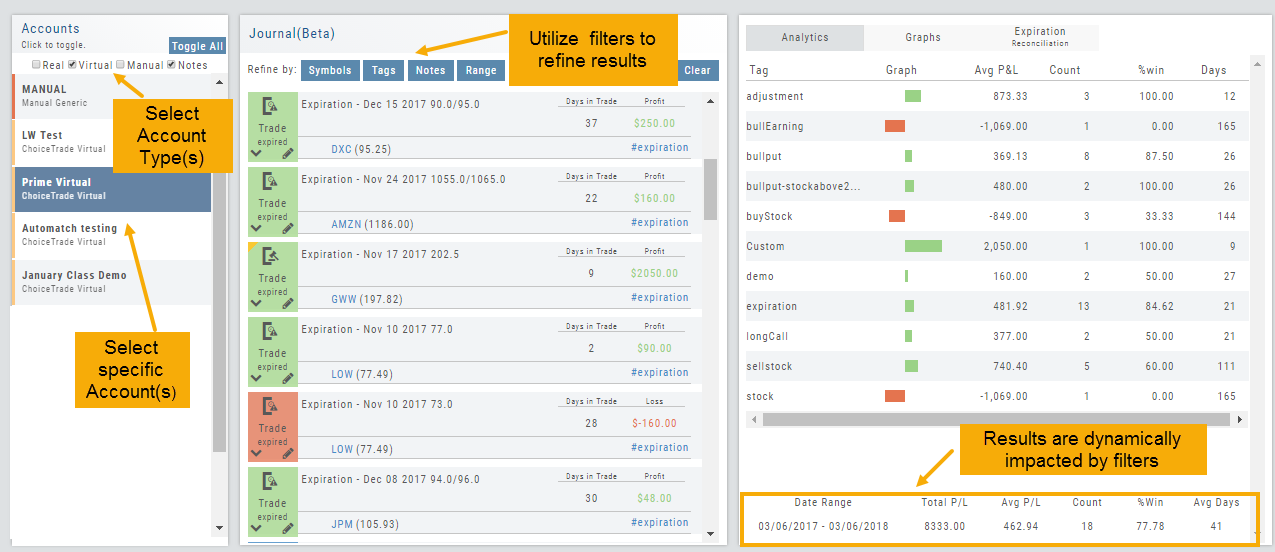
Not only does this table provide valuable information, you can use it to compare strategies, track improvement in your overall trading, etc.
P/L & Duration/Timeline Graphs
Journal Trade Graphs
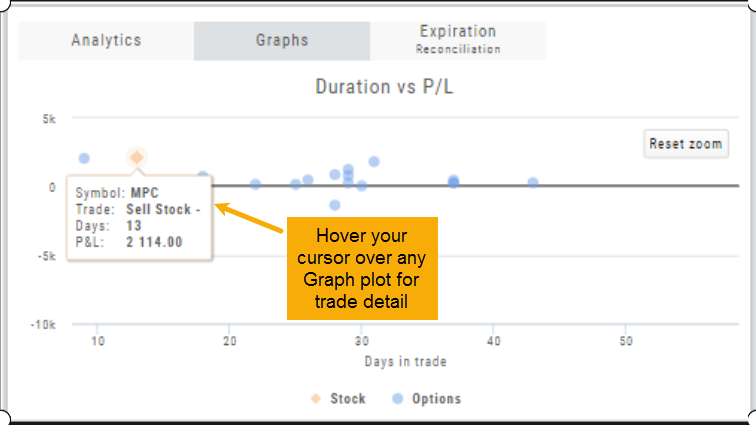
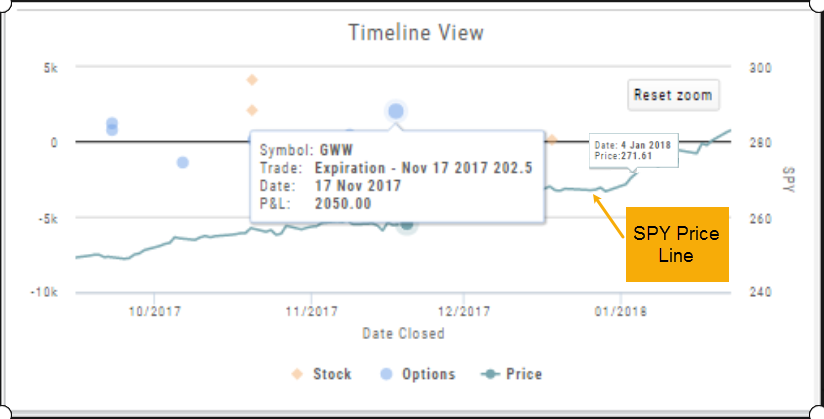
This tab offers two views of your Closed, Matched or Reconciled trades: P/L by Trade Duration and P/L by Timeline. The views update dynamically by Account, Symbols, Date Range and #tags.
The Timeline Graph.
Click/Drag your cursor to adjust/enlarge the orientation view.
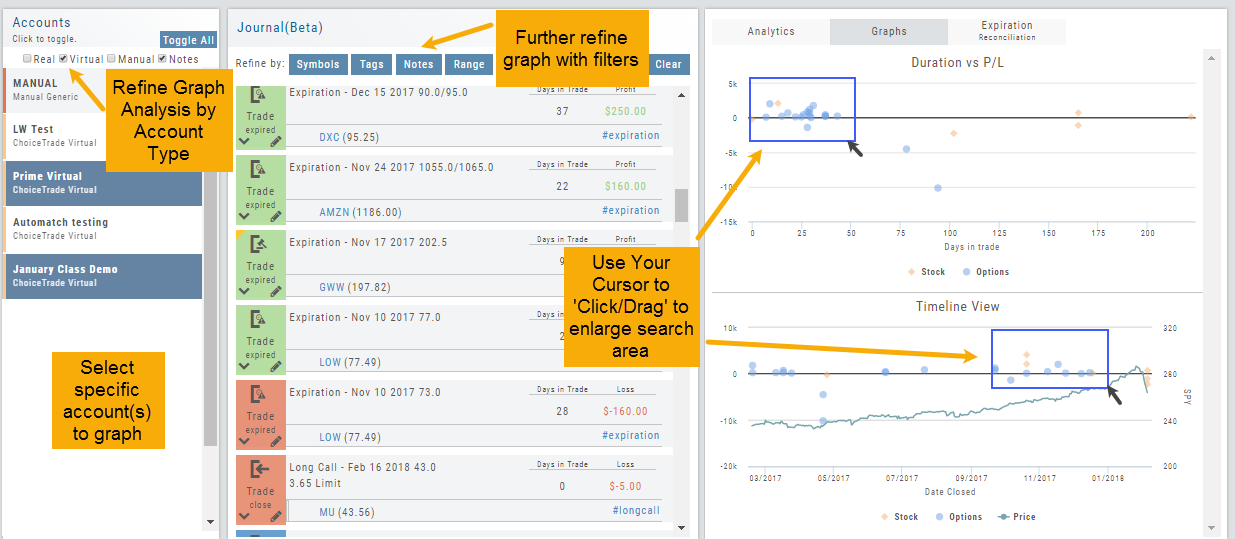
Hover your cursor over each graph plot for trade detail. Circles = Option Trades, Diamonds = Stock Trades. The Duration View shows P/L and # of Days in the Trade
Timeline View displays P/L on Date Closed or Expiration
SPY Price is displayed on the Timeline View. Slide your cursor along this graph line to show end-of-day price for that date.
Journal Tab – Reports
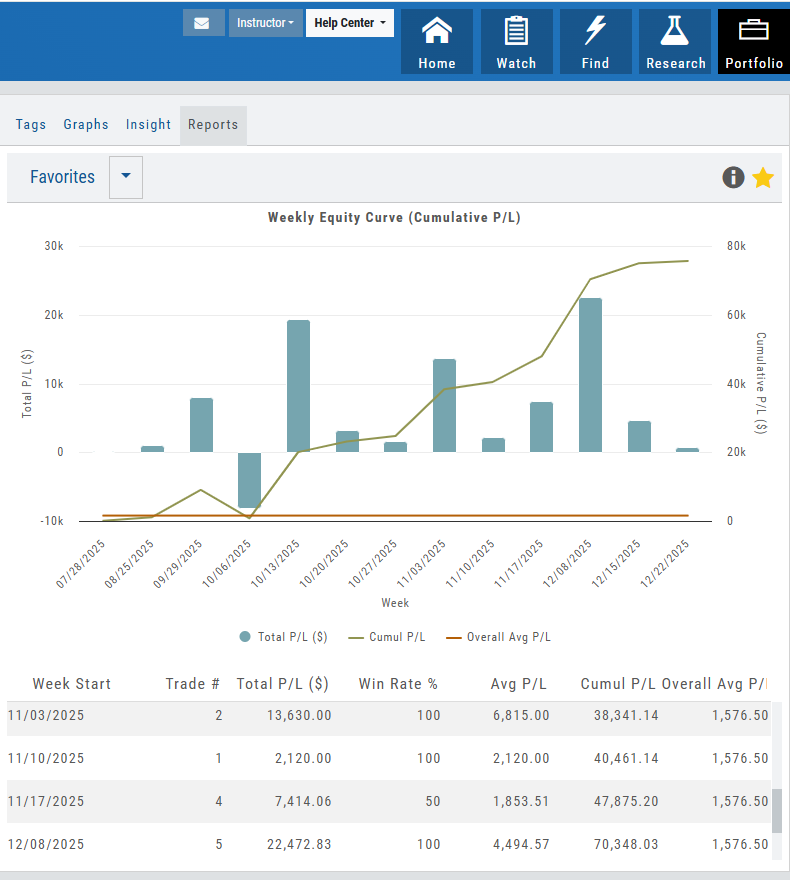
Journal Reports
Understanding your trading performance shouldn’t require digging through spreadsheets or guesswork. Journal Reports turn your trading data into clear, visual insights—so you can quickly see what’s working, what’s not, and where to focus next.
With intuitive graphs and concise summary outlines, Journal Reports provide a high-level view of your account performance across multiple categories, helping you connect the dots between results, behavior, and decision-making.
Whether you’re reviewing weekly performance, refining your edge, or building better trading habits, Journal Reports transform raw data into actionable insight—at a glance.
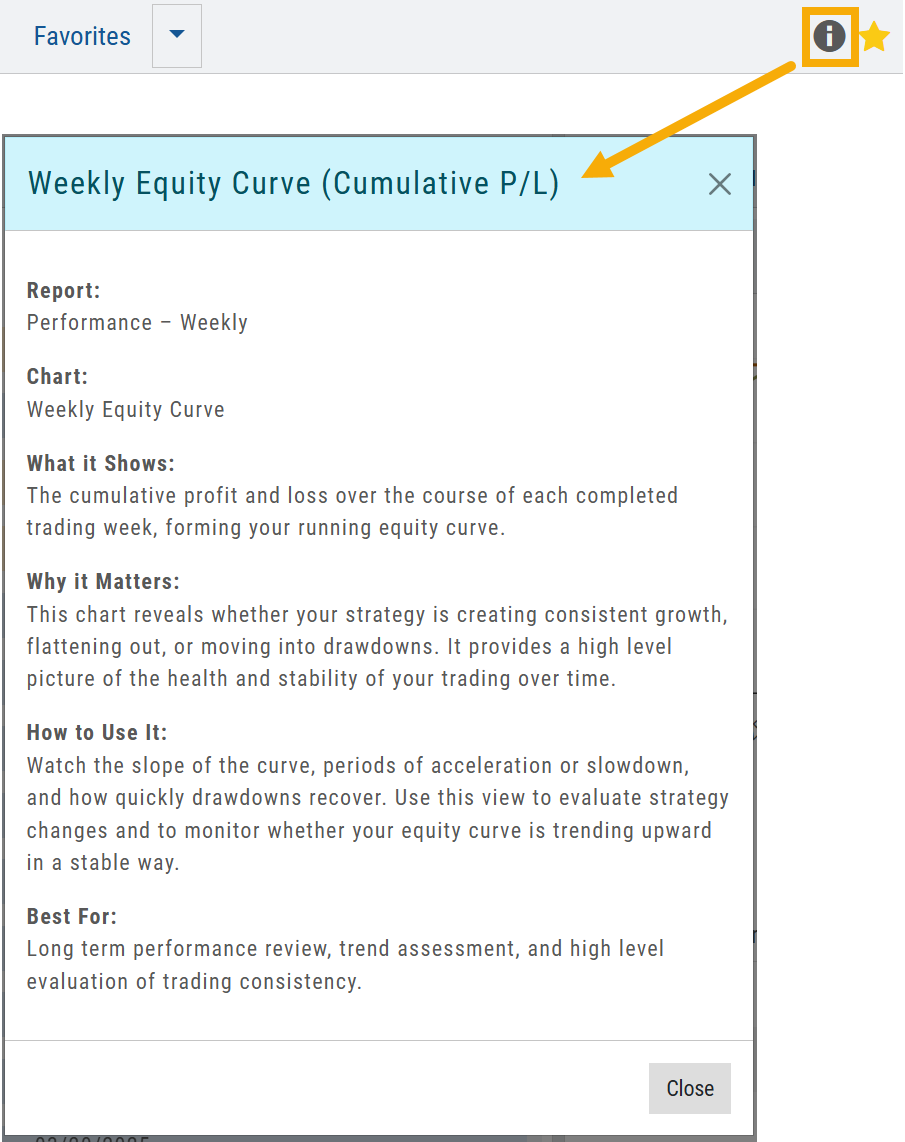
Click the Info Icon  for a detailed outline on:
- What information the report provides
- Why it matters
- How to use it
- The application(s) the report is Best used for
Report Legend
Each Report has a legend where indicators can be toggled on/off simply by clicking on each one.

Journal Reports include insights by:
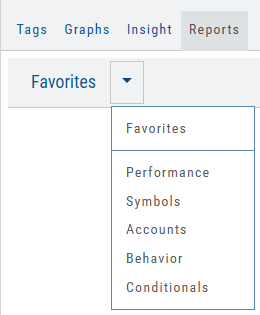
- Performance – Analyze results by time period to spot trends and consistency.
- Symbols – Identify which tickers were your most and least profitable.
- Account – Review performance across individual or multiple accounts.
- Behavior – See how trading habits impact outcomes.
- Conditionals – Evaluate performance based on specific trade criteria or setups.
Click on one of the above categories, then click on the Report to display
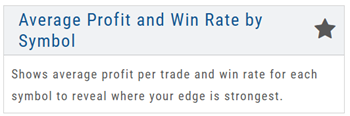
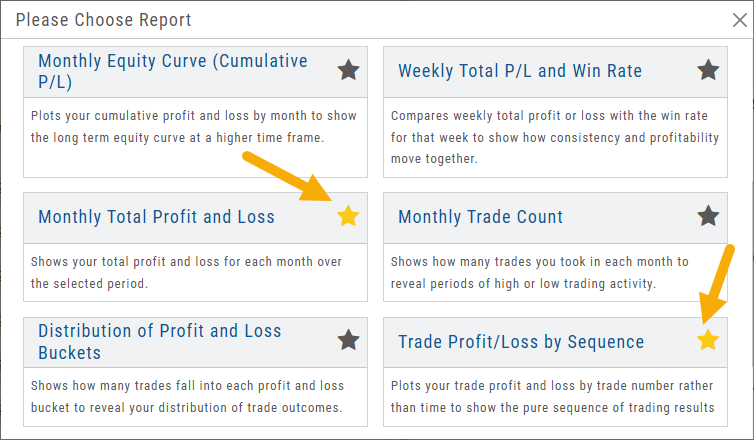
To make analysis even easier, users can group their Favorites into a single section—allowing you to focus on the symbols, strategies, or reports that matter most to you.
Simply, click the Star Icon to highlight each Report to keep under “Favorites”
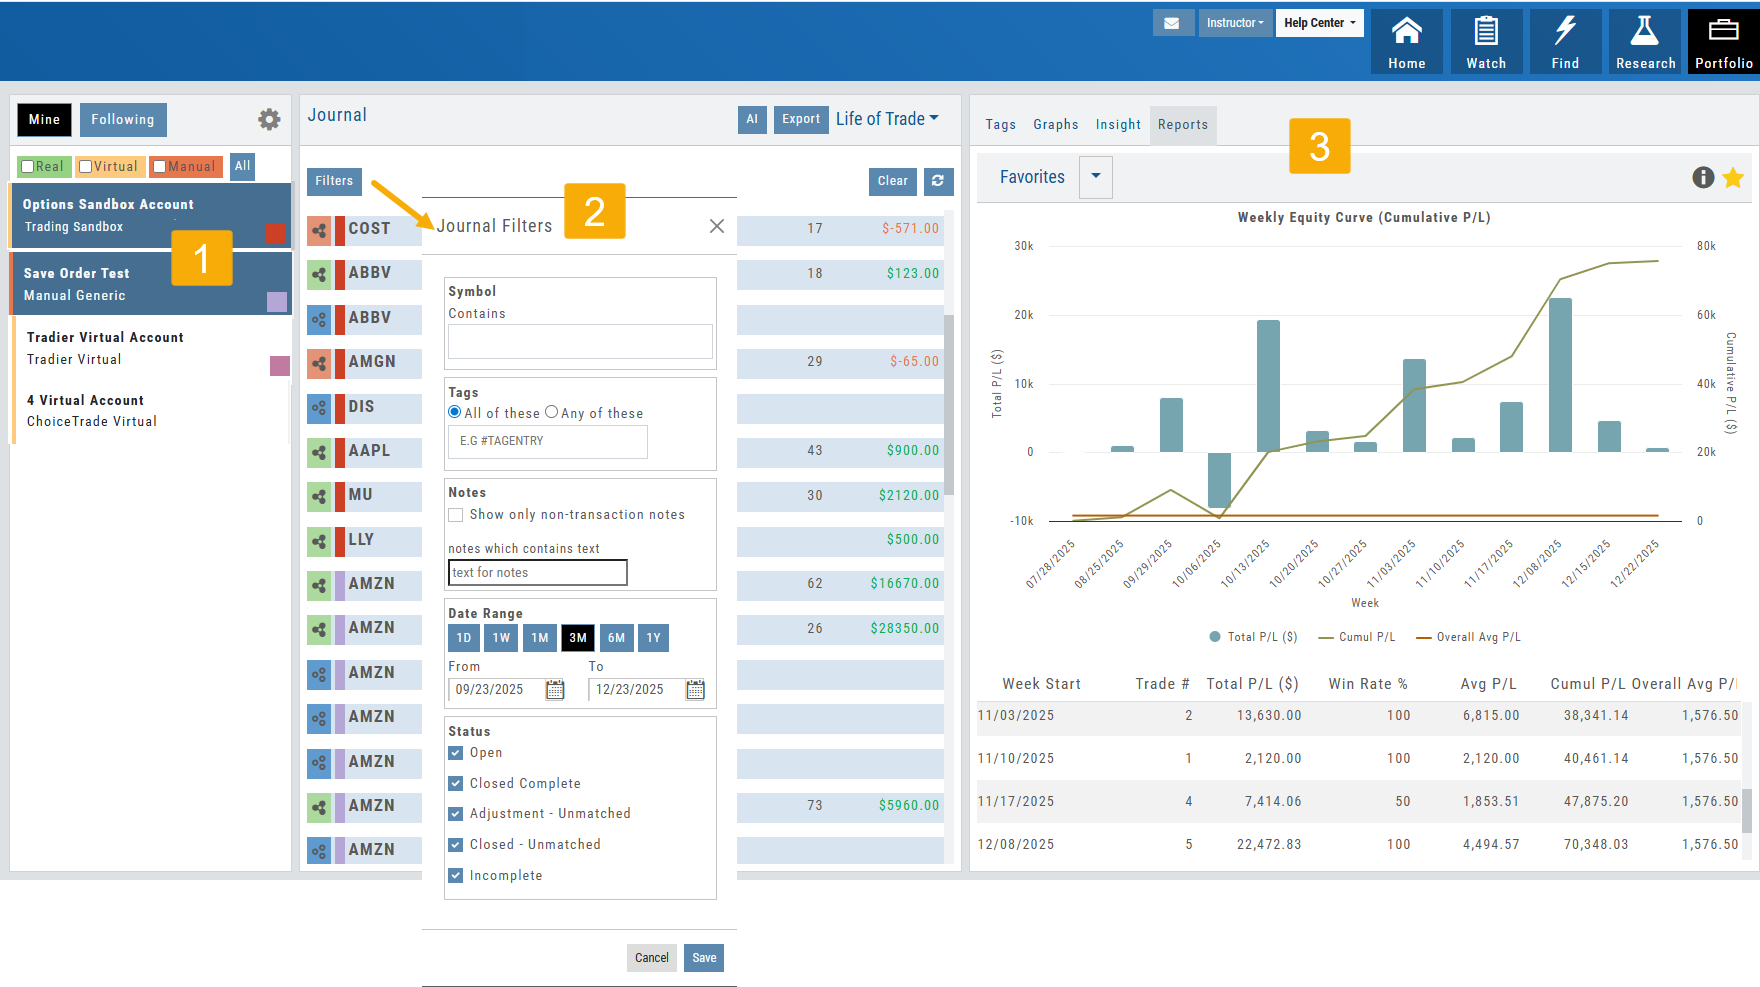
- The account(s) selected on the left side of the Portfolio Tab display the activity in the center panel for the default time period of 12 months
- Use the Filter Button to adjust the time period, symbols, etc to display
- The results from the center panel will be displayed on the right panel
Export Reports (Desktop)
Clicking on  located on the upper left corner of the Positions and Gains tabs allows you to export that information as a .csv file.
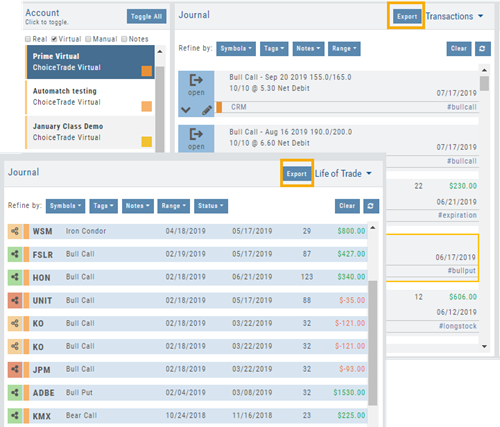
The Journal gives you the ability to export reports in a PDF file on your desktop platform. But that’s just the beginning.
You can export from the Transaction or Reconciliation view filtered by Account, Symbol, Tags, Notes and/or Date Range.
Life of Trade View also allows you to filter by Order Status in addition to the above criteria for an even more focused report. Only want to print Closed Trades? Want to see how many trades are Unmatched? Select those filters.
The top of your Journal report displays the Tag Summary based upon the account(s) and filtering criteria selected.
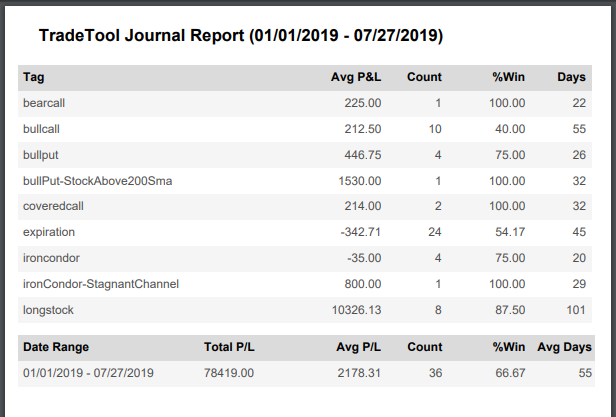
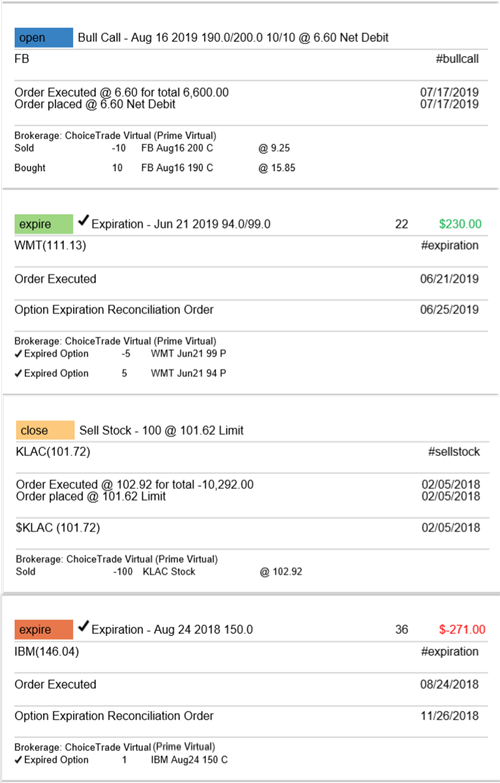
The trade detail report displays the status, Open, Close, Expire with a color code of the trade: Blue=Open, Green=Profit, Red=Loss, Yellow=Unmatched.
AI capability: Journal Analysis
Journal AI Analysis – Now it’s easier to track your progress AND get feedback!
- Get observations and analysis on your selected portfolio accounts
- Recommendations offered to help improve outcome
- Flexible – select different time frames to compare results over time
Journal AI Analysis will review your account activity and provide insight, observations and recommendations.
Note: Analysis applied to closed positions only. This feature does not forecast unrealized gains or losses.
Your Journal AI Analysis will review your Trade Journal and provide insight, observations and recommendations.
Below are steps to get started.
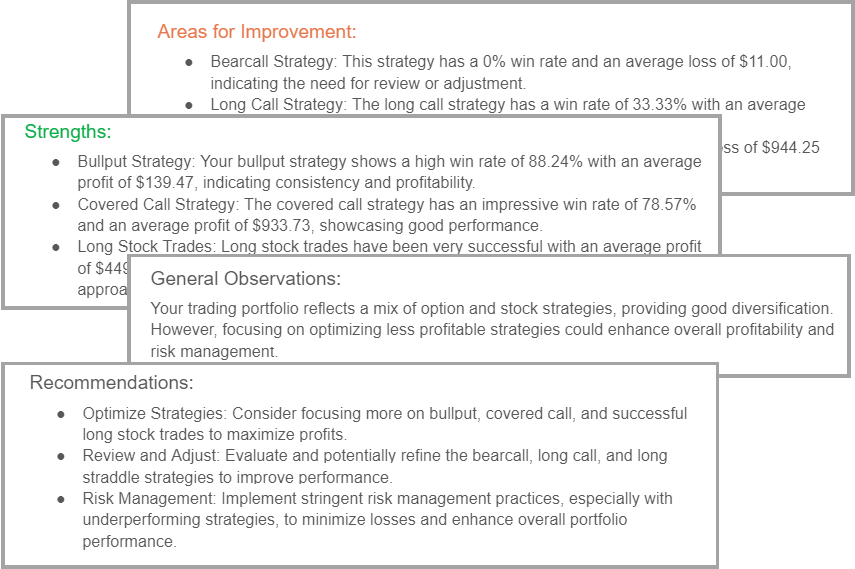
Within a few moments, you’ll receive a summary of Strengths, Weaknesses, Observations, and Recommendations for improving results.
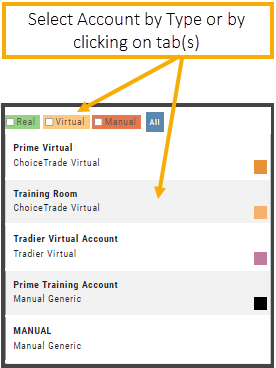
Select Account(s) to analyze by clicking on the Account Tab
OR
Select by Type: Real, Virtual or Manual
Tip: Keep the selection to a limited number of accounts for a more targeted analysis.
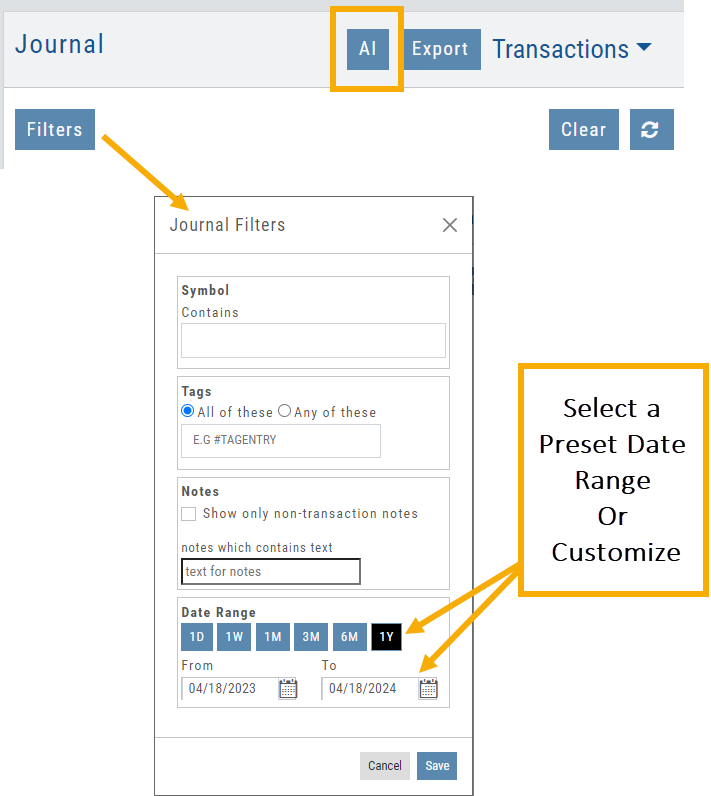
Click on the “Filter” Button from the middle panel
Select the date range to be reviewed. The default period is 12 months.
Add additional filters by selecting specific tags (#BullCall) and/or specific symbols
Click “Save” on the Filter Tab
Tip: You can change these settings, Save, then ‘refresh’ the report on the next step
Finally, click the AI button at the top of the screen, then click the  button to get the report.
Important to Know
- Analysis is limited to closed trades. Make sure all trades in that account for the period covered have been reconciled.
- The report is available during your current session while you explore your Journal. If you change Accounts or revise any Filter settings, simply click the Run/Refresh button again.
- Iterate and Refine. Select different time frames to review results over time. Run reports to compare Real Accounts to Virtual ones.
As with all AI content, consider this as input. Make your own educated decisions
Testing ideas before you trade
Backtest from the Journal
The Journal is not only a record of trades you have placed. You can test an idea against past data and keep the result alongside your real trades.
You can “Replay” a trade from your Journal by sending it to Backtest Analysis.
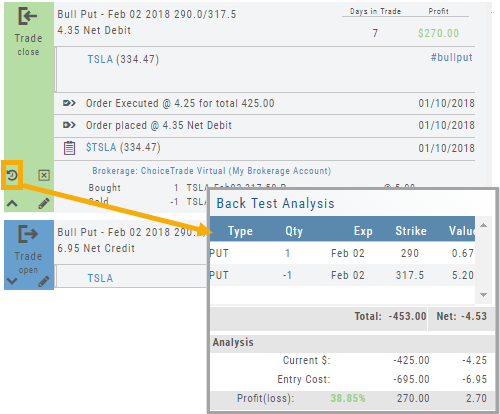
Click on the  icon on the Journal trade tab.
Trades are sent to the specific strategy template of the trade.
If you click on the “Trade Open” tab, you will only get that view of the trade.
If you click on the “Trade Close” Journal tab, you get both open and closing info sent to Backtest.
View the P/L, Price History, Stock Volatility Chart – be sure to utilize the “Go Big” function to see more detail of the trade.
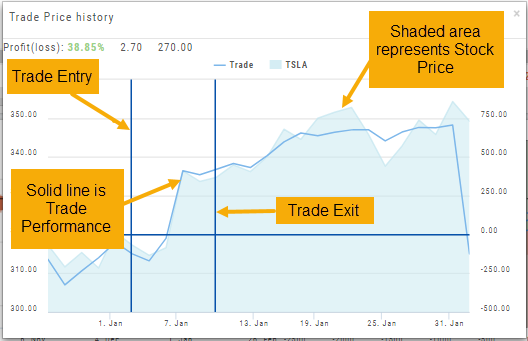
Note: This function is available on a “Clean” trade. Clean means there was a clean Open and a clean Close of the trade. There were no partial closings, ‘roll-ups’, adjustments or exercise/assignments.
Save Backtested Trades to Manual Account
Want to keep record of backtested trades?
Send them to the Manual Account. While in Backtest Mode, structure your trade as usual in the Options Chain or in a Strategy Template. Then click “Save”.
The “Trade” button becomes “Save” when in Backtest Mode.
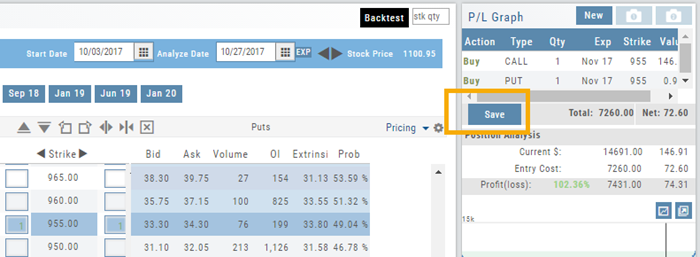
You have the option of saving the Entry or Entry and Exit of the trade. Each tab has specific information such as Total Cost when opening the trade and Total Credit (Debit) when Exiting the Trade.
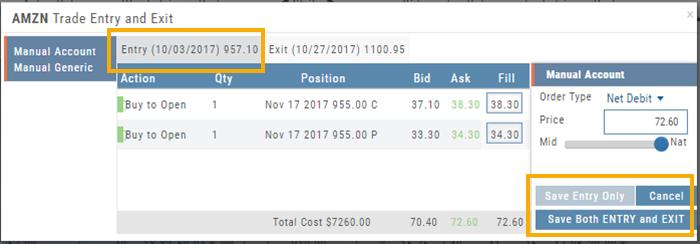
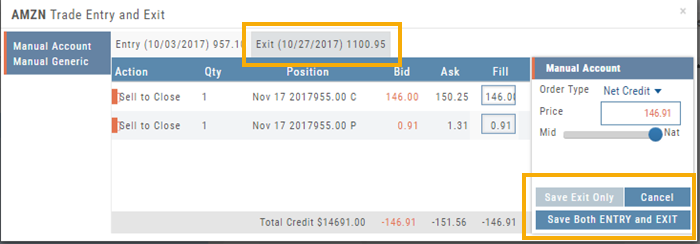
You’ll have the option to Save both the Entry and Exit positions on the “ticket”. You can also choose to save only the Entry OR Exit if you wish. So if you want to post an opening trade on a past date, but still have it open now, you can Save Entry Only on the Entry part of the Ticket.
Journal too
Once saved, you can see these trades in your Journal. You can add notes and tags. Simply click Journal in Order Status, or edit in the Journal.
Sharing your trades and Journal
A Premium desktop feature. You can let someone else follow your trades and Journal, or follow an account that has been shared with you.
Set Up Trade & Journal Sharing (Premium Desktop Feature)
Trade and Journal Sharing
Step 1:
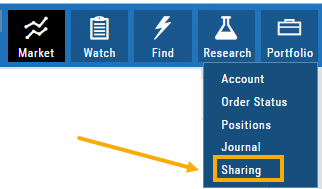
Select “Sharing” under the Portfolio Tab to access these features of sharing trade ideas with peers or trading groups or have access to an Instructor’s Trades or Journal History.
Trade Sharing allows for potential trades to display in “Order Staging” listing the Source of the Order.
Journal Sharing can be used to follow a Trading Group, Instructors, Peer, Public Accounts as well as Newsletters/Trading Room applications.
Step 2: On the left-hand panel, click on “My Shared Accounts”
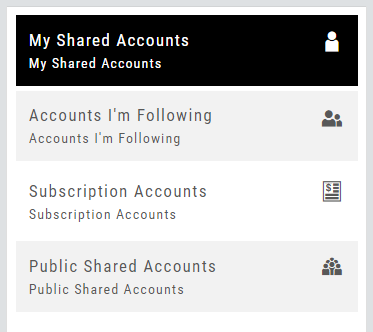
Shared Accounts are grouped into 4 categories:
- My Shared Accounts – Elect to share Order Staging and/or Journal Sharing
- Accounts I’m Following – Other peers, trading partners, instructors
- Subscription Accounts – Newsletter or Trading Group applications
- Public Shared Accounts – allows access to a Public Directory with performance metrics
Step 3: Set up your User Profile
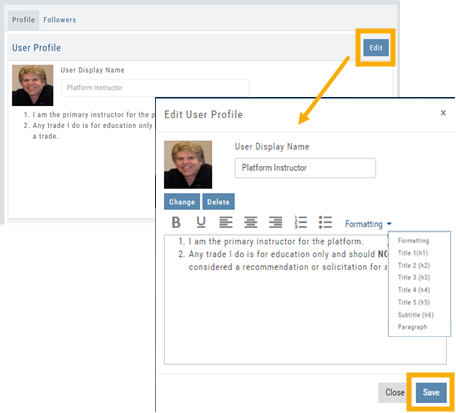
Click “Edit“
Add a User Display Name
Provide a Bio and/or Information about the account. This is what others will see.
The Formatting option allows you to customize the Bio/Information box.
Click “Save“
Step 4: Set Up Account Profile
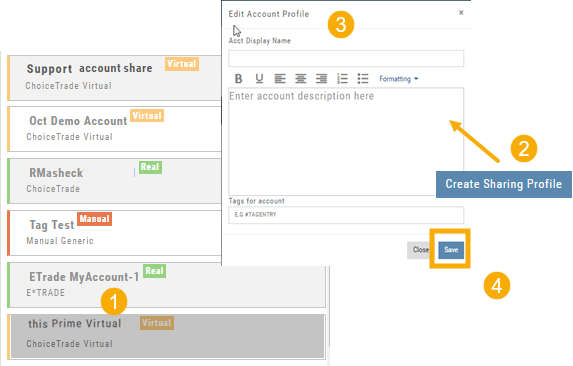
1. In the middle panel, click on the Account to be shared
2. On the bottom right panel of the page, click on “Create Sharing Profile“
3. On the pop-up window, add an Account Display Name and Account Description.
Note: Both are required.
You are also able to add #tags to this Account Profile.
4. Click “Save“
Account options
Once Shared, you can “Unshare” account by clicking on button located in the upper right of this box.
Share Journal is checked by default.
Check box for Share Staged Trades if you wish to provide that on the selected account.
A code is automatically generated to Privately Share/Peer-to-peer share
Duration drop-down menu allows you to set how long the code is valid:
Single use only
Hour
Day
Week
Until Disabled
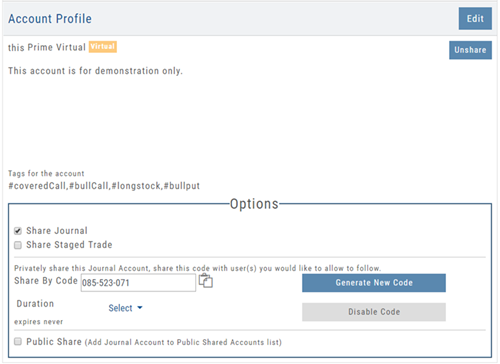
Available buttons allow you to Generate New Code and Disable Code.
Following a Shared Account (Premium Desktop Feature)
Under Portfolio>Sharing, click on “Accounts I’m Following” on the left-hand panel.
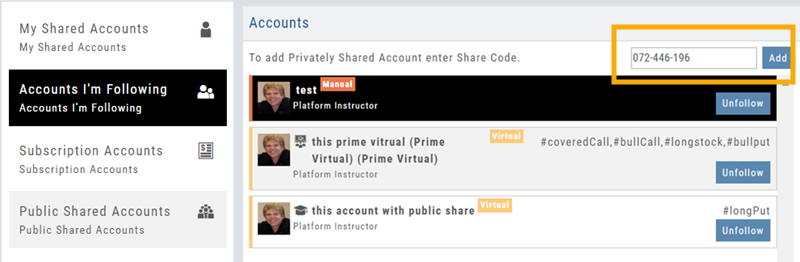
The center panel, above the Account List has a section to enter the code for the Account to be shared on your platform. Enter the code, then click “Add“
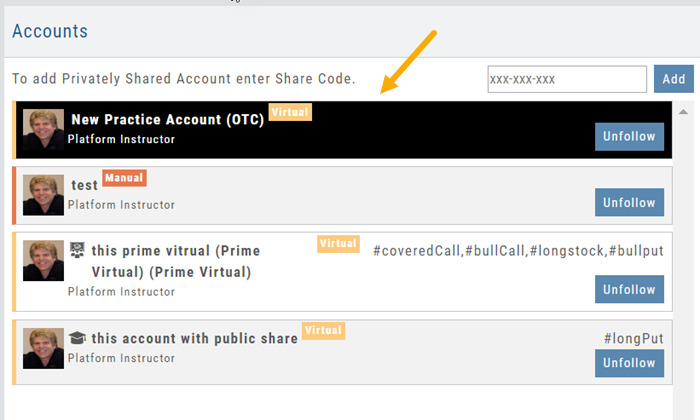
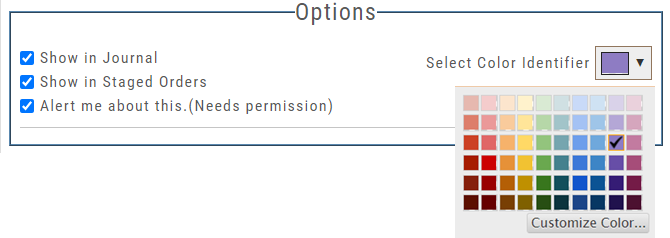
On the bottom, right panel box under “Options“, make sure to check boxes:
Show in Journal
Show in Staged Orders
Alert me about this (Needs permission)
Your device’s settings need to be permissioned for Alerts.
Finally, for easy trade identification, select a color identifier from the dropdown box in the right corner of the Options box.