
Search for answers or browse our knowledge base.
Journal – Trade Results
Trade Details
The Journal allows you to view your trade results, including a visual outline of the position from Open to Close, including any Adjustments and Expirations.
Start in the Life of Trade view.
Click on the Gain/Loss value on the far right of the trade entry
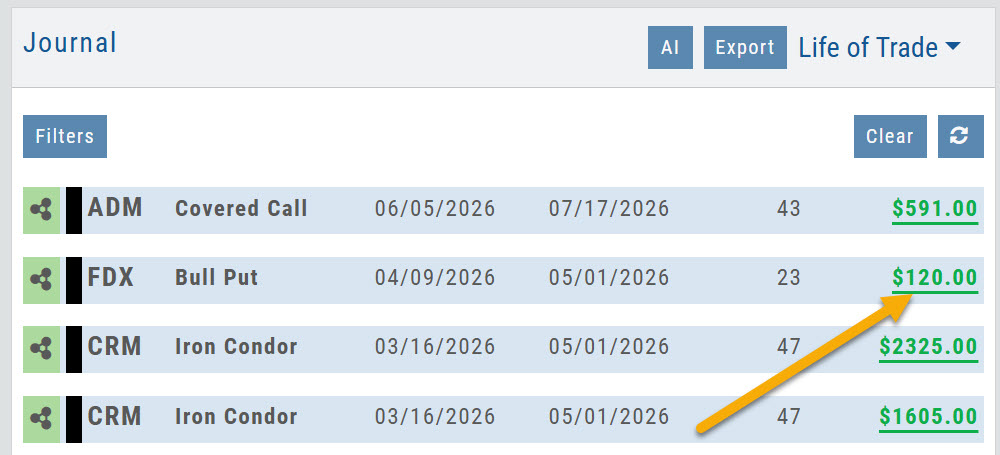
Stock Journal Entry
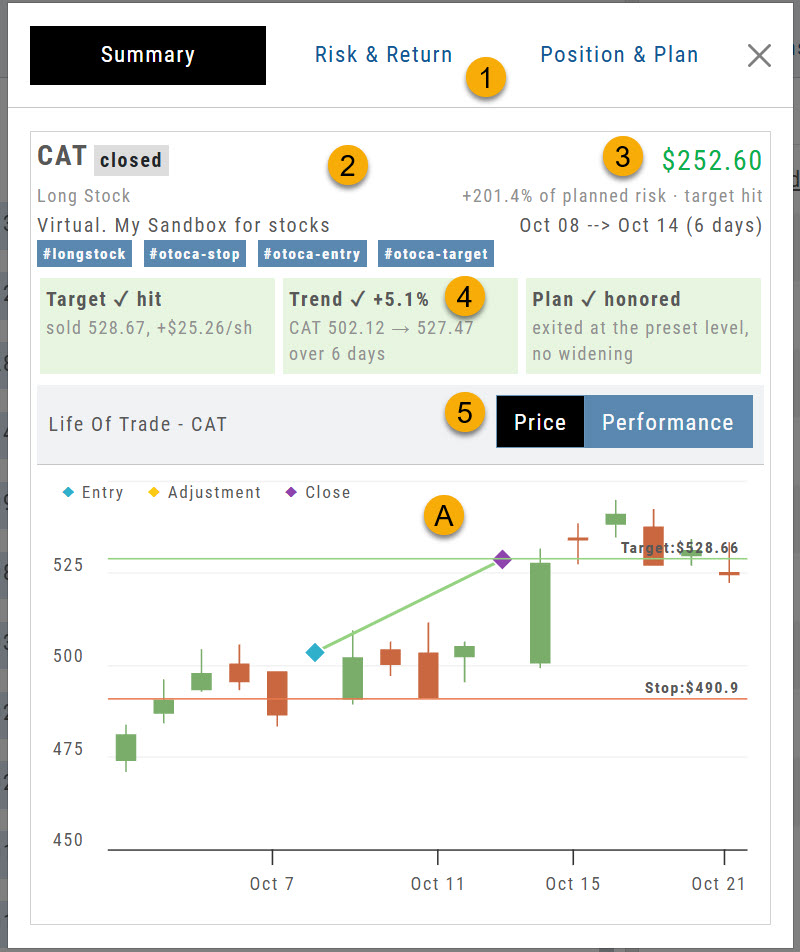
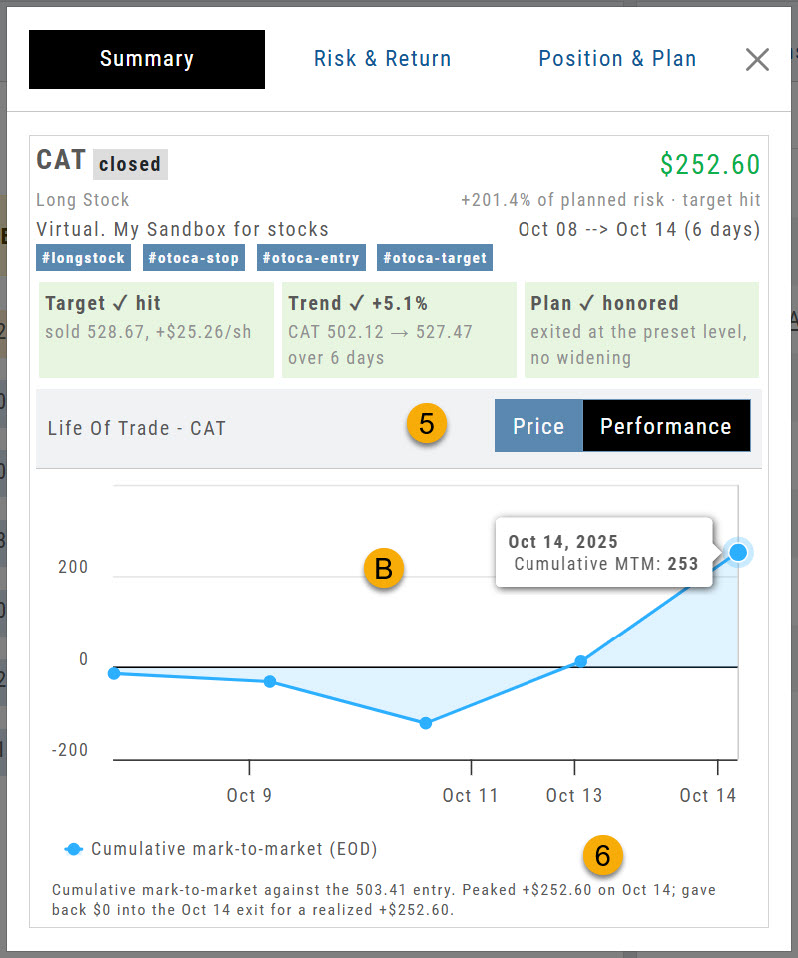
- Overview Tabs: Summary, Risk/Return, Position & Plan
- Trade Summary: Symbol, Trade Status, Position, Account & Tags
- Results: Profit/Loss, % of Target, Duration of Trade
- Evaluation: Color represents a contributing or detracting factor in the trade
- Price/Performance
A. Candlestick chart with position entry/adjustment/close – and OCO Stop/Limit, if applicable.
B. Cumulative activity for trade duration - Summary of Performance
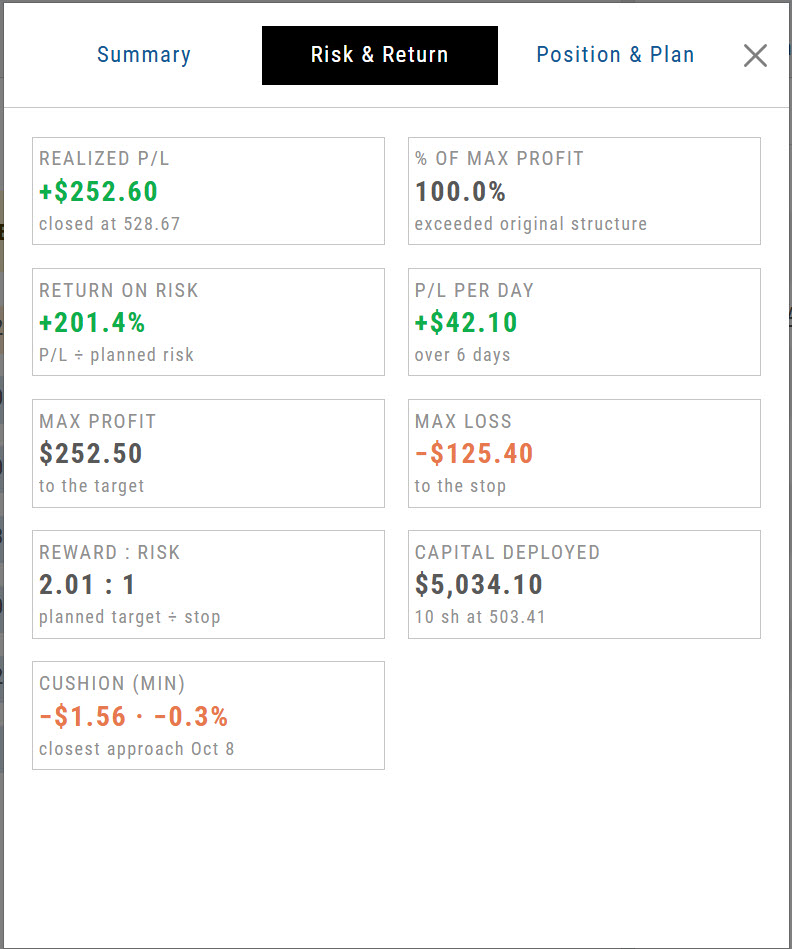
The Risk & Return Tab outlines the trade results.
In this bracket order example:
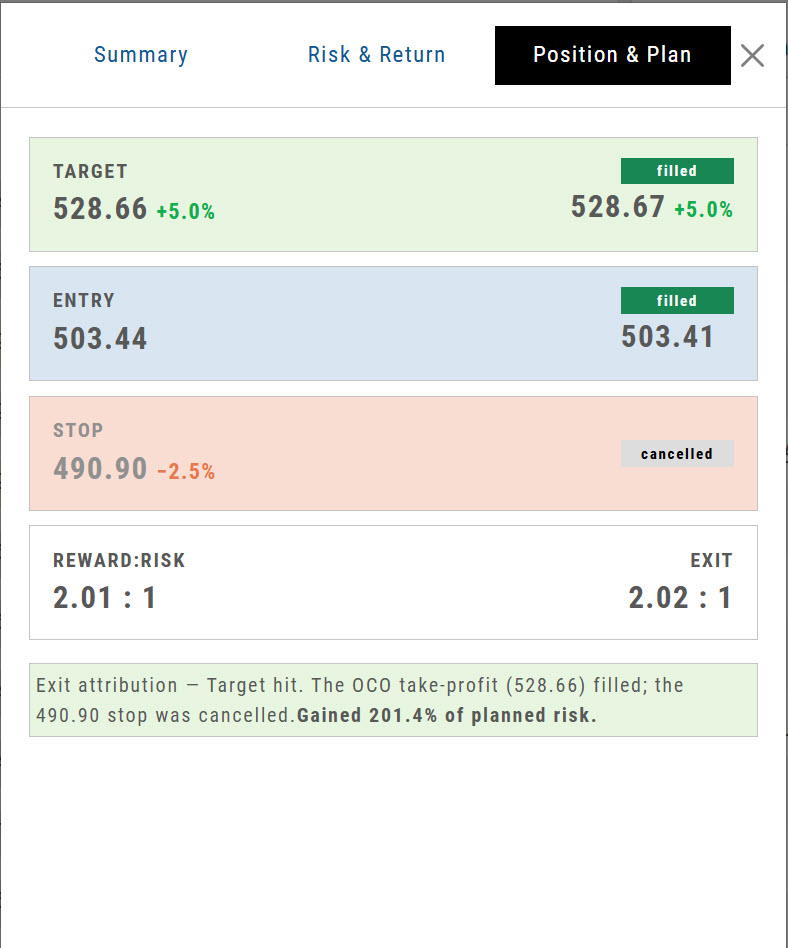
10 shares were purchased at a lower entry price ($503.41) than the order price of $503.44.
6 days later, the Target of $528.66 was reached, and the close order was executed at $528.67
The Stop Order ($490.90) was cancelled automatically.
The original plan outlined a 2.01 Reward:Risk ratio. Due to the lower entry price and higher close price, the result was a slightly higher R/R of 2.02.
The Position and Plan tab offers a breakdown of the trade results.
In this example, the stock trade was executed at a better price and reached its target price to close, which was also at a better price. The Stop order was cancelled.
The result shows a slightly better than expected Reward: Risk ratio
Option Journal Entry
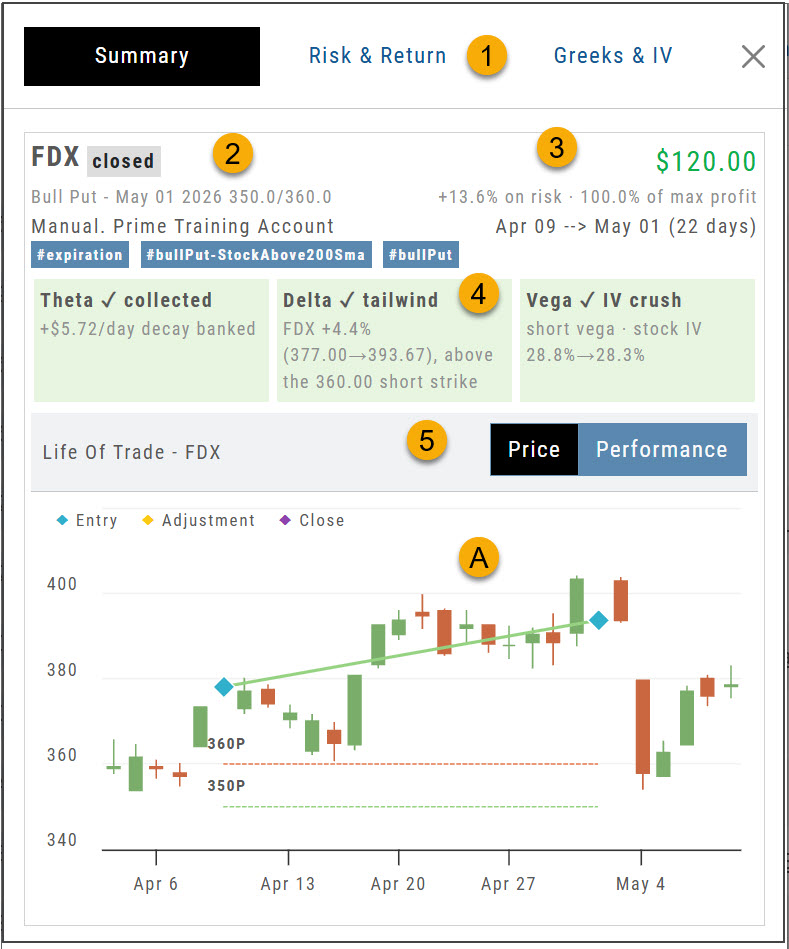
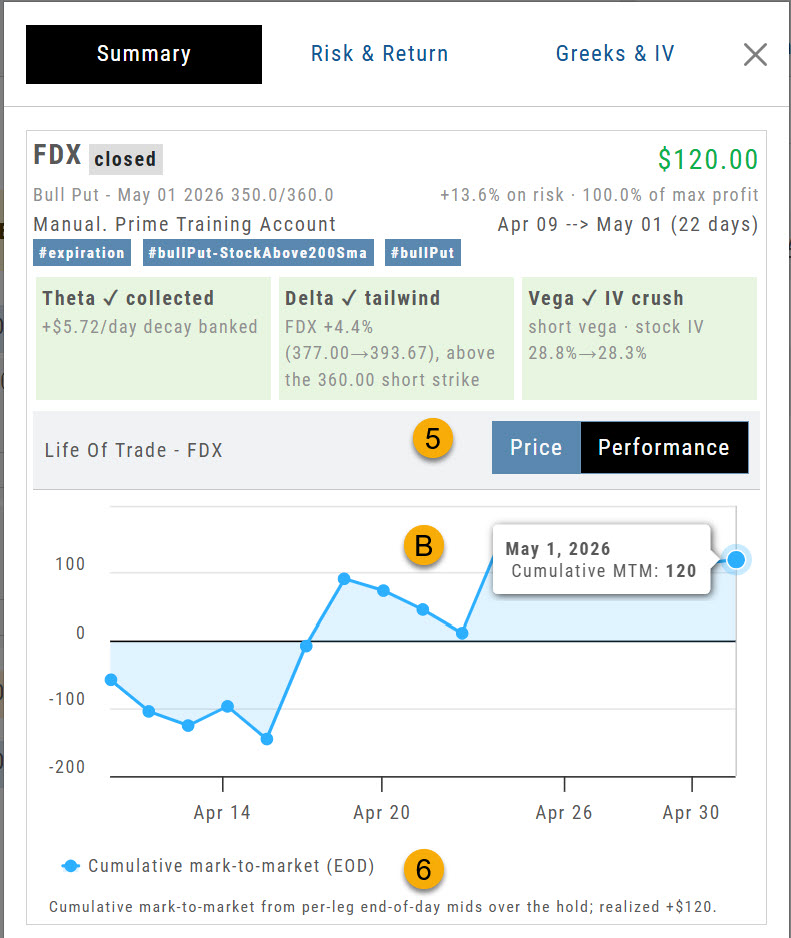
- Overview Tabs: Summary, Risk/Return, Greeks & IV
- Trade Summary: Symbol, Trade Status, Position, Account & Tags
- Results: Profit/Loss, % of Target, Duration of Trade
- Evaluation: Up to 3 Primary Drivers of the Trade
- Price/Performance
A. Candlestick chart with position entry/adjustment/close
B. Cumulative activity for trade duration - Summary of Performance
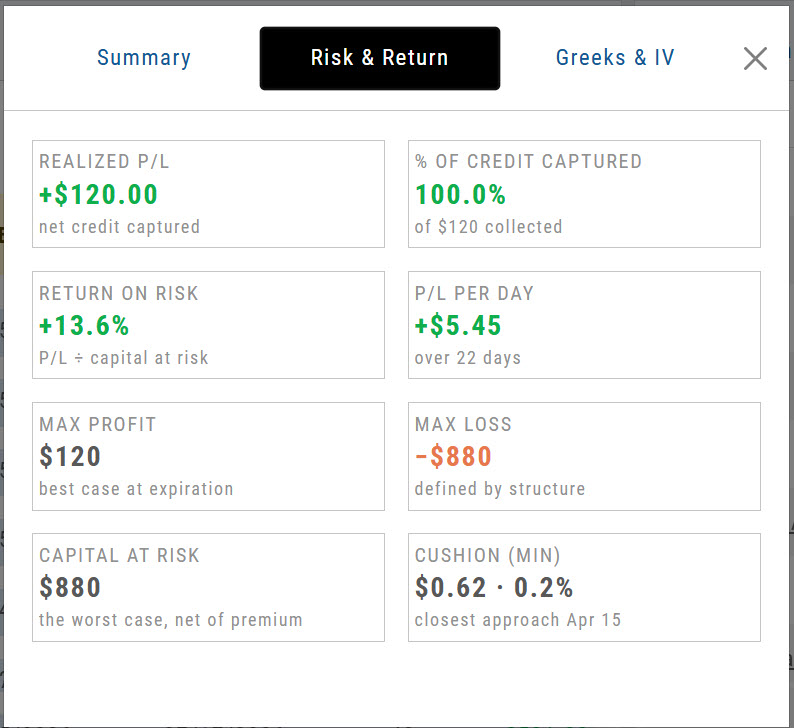
The Risk & Reward Tab summarizes the trade outline and result.
In this example:
The $10 Bull Put Spread resulted in Max Profit of $120 and Max Risk of $880
Duration: 22 days; profit per day: $5.45 ($120/22)
Return on Risk: 13.6% (120/880)
Cushion: How much below the break-even point the trade reached
 .62″ class=”wp-image-1252″ width=”400″ style=”width:400px;height:auto”/>
Greeks & IV Explained
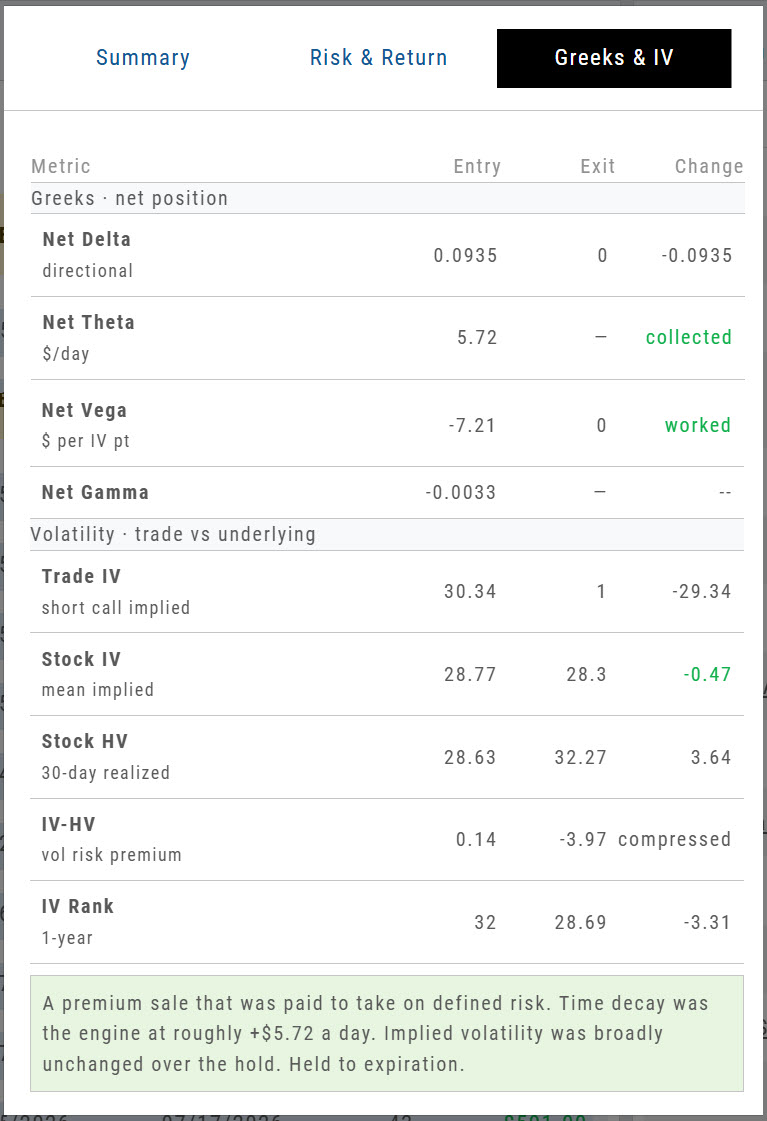
| Metric | What it tells you | Change column shows |
|---|---|---|
| Net Delta | Directional exposure — roughly what the position gains or loses per $1 move in the stock | Signed number |
| Net Theta | $/day — premium the position collects (+) or pays (−) each day it’s held | collected / paid |
| Net Vega | $ per IV point — what the position gains or loses per 1-point change in implied volatility | worked / hurt / faded |
| Net Gamma | How fast Delta itself moves as the stock moves — negative for credit spreads and short premium | Signed number |
| Trade IV | The implied volatility of your own legs — what you actually sold or bought | Signed number |
| Stock IV | The underlying’s mean implied volatility, with HV (30-day historical) shown beneath it | Signed number |
| IV − HV | Volatility risk premium — how far implied sat above (or below) what the stock has actually been doing | Signed number |
| IV Rank | Where implied volatility sat in its own 1-year range, 0–100 | Signed number |