
Search for answers or browse our knowledge base.
-
Platform Overview
-
Onboarding Guide
- Articles coming soon
-
Account & Settings
-
Brokers & Accounts
-
Charts & Indicators
- Chart Period Controls
- Extend Fibonacci Retracements on Charts
- Chart crosshairs
- Heat Maps Too
- Working Orders Displayed on Chart
- Chart Types
- Customizing Indicators
- Lower Indicators
- Crossover Arrows
- Chart Navigation
- Adjust Chart Height & Width
- Advanced Indicators
- Adding & Arranging Indicators
- Add/Delete/Save Chart Profiles
- Zoom Feature
- Trade from the Chart
- Chart Adjustment/y-axis
- Intraday Charts displaying Pre/Post Market Activity
- Trend Lines, Notes & Shapes and Advanced Annotations
- Heat Map View
- Heat Map Data Points
- Heat Map Filters
- The Legend - Heat and Spectrum Maps
- Heat Map & Spectrum Overview
- Spectrum Map View
- 52 Week High/Low Value
- Industry Performance Bar Chart
- Explore - Give it a try!
- Journal Activity Line
- Global Chart Settings
- Chart Adjusts for Splits
- 52-Week Hi/Low Indicator
- Show all articles ( 17 ) Collapse Articles
-
Trading & Orders
- I own the stock, how do I enter a Covered Call trade?
- Order Status Filter Buttons
- Bracket Order Adjustment
- Order Types - How to Enter
- The Order Ticket - Stock/ETF
- Conditional Orders (OCO)
- Order Staging (Premium Desktop Feature)
- Access Trading Account Information
- Virtual Account Buying Power Calculations
- Smart Trade Ticket
- Reward/Risk on the Order Ticket
-
Options
- Create Customized Option Table Views
- Option Chain Functionality
- Where are the Greeks?
- Entering a Position
- Trading from Options Page & Strategy Templates
- Trade from the Options Tab
- Trading from the Option Template
- From Strategize to Analyze to Trade
- Strategy Template
- Elements of the Template
- Strategy Snapshot
- Storyboard of the Strategy
- Performance Channels
- Delta & Theta Display on Template
- Profit/Loss Graphs
- Advanced Analytics
- Historic & Implied Volatility
- Options Chain Analysis
- Go Big - Graphs & Charts
- Clickable Legends
- Price Slices - Premium Feature
- Multiple Position Analysis
- Position Indication on the Chain
- Trade Management
- Rolling Positions
- Snapshot: Comparing Positions
- How to use Backtesting
- Start Date
- Analyze Date
- Backtesting Trade Finder scans
- Use SNAP to Backtest Positions
- The Power of Time
- Bid/Ask Spread - Premium Percentage
- Strategy Metrics on the Option Chain
- Show all articles ( 19 ) Collapse Articles
-
Positions & P&L
-
Journal
- Journal Auto-Reconcile
- Journal Tab - Reports
- Color Codes of The Trade Journal
- Life Of Trade Icon/Color Codes
- Link Trades in Journal
- Create Notes to Keep Organized
- Set Up Trade & Journal Sharing (Premium Desktop Feature)
- Journal - Color Tagging
- Journal Tag Analytics
- Symbol Journal
- Journal Navigation
- Updating Journal Entries
- Add New #tags and Auto-Tagging
- Delete Journal Entries
- Backtest from the Journal
- Save Backtested Trades to Manual Account
- Journal Account Multi-Selector
- Tag Results-Table Summary Totals
- P/L & Duration/Timeline Graphs
- Reconcile Trade Notice
- Updating Journal Entries
- Insight Tab in Journal
- Export Reports (Desktop)
- Following a Shared Account (Premium Desktop Feature)
- Life of Trade Journal View
- Journal Tagging - OCO, Trailing Stops, etc.
- AI capability: Journal Analysis
- Refine Journal Entries by 'Status'
- Automatic Account Syncing - Up to 2 Months
- Journal - Trade Results
- Greeks & IV Tab Explanation
- Show all articles ( 16 ) Collapse Articles
-
Watchlists
- Research Watchlist Functionality
- List or Tile View
- Sending from One “List” to Another
- Watch - The Next Step
- Create Watchlists
- Multi-Select Stocks
- Manage/Modify Watchlists
- The Other Lists
- Tile View Sizes
- Customize Watchlist Views
- Create Watchlists from Spectrum View
- Quote Detail without leaving the List
-
Alerts
-
Scanners & Screeners
- Intraday Trade Finder Scan Updates (Premium Desktop Feature)
- Overview of Scans
- Scans - Find Opportunities - Overview
- Scan - Smart search
- The Tile
- Dynamic Scan Information
- Past Scan Results
- Save your Favorite Scans
- The Top 4 Categories
- Filter Scan Icon
- The Dashboard Scan Tab
- Calendars
- Earnings Per Share Performance
- Screener (Premium Desktop Feature)
- AI capability: Financial Coach
- AI capability: Screener
- Show all articles ( 1 ) Collapse Articles
-
Stock Research
- Technical Analysis
- Research
- Overview & News
- Earnings, Dividends and more...
- Price Change Indicator
- Fundamentals
- Fundamentals Tab
- Key Ratio (formerly Valuation)
- Valuation
- Compare Tab
- The Power of "The Score"
- Designed to provide the level of information you want
- Inner Circle - Behind the Scenes
- Inner Circle - Inside Score
- Inner Circle - Institutions
- Inner Circle - Money Flow
- Trade Transaction Types
- AI Analysis
- Show all articles ( 3 ) Collapse Articles
-
Market Intelligence
-
Strategies & Automation
- Articles coming soon
-
Release Notes
- Articles coming soon
-
Billing & Subscriptions
- Articles coming soon
-
Troubleshooting & FAQ
- Articles coming soon
Heat Map & Spectrum Overview
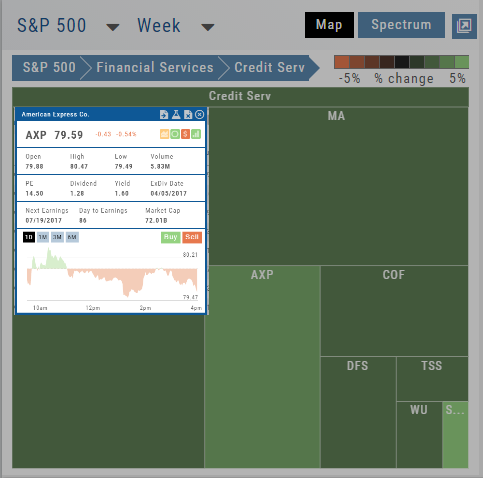 Financial Services > Credit Serv on the Week view, with the American Express quote popup open: price, Open/High/Low/Volume, PE, Dividend, Yield, ExDiv Date, Next Earnings, Market Cap, and a 1-Day chart with Buy/Sell buttons” class=”wp-image-573″ width=”360″ height=”356″ style=”width:360px;height:auto”/>
For Example: Clicking on “Financial Services” industry portion on the map of the S&P 500, then “Credit Services” will yield another map of 8 companies: Visa, Mastercard, American Express, etc. Clicking on any of those boxes will display the Stock info at a glance. Notice the Navigation Icons such as The Score as well as those to add to a Watchlist or send to Research.
The “Spectrum” View maps the sectors within the Index, with the number of companies in (parenthesis) by the performance by the time-frame selected. You can drill-down by selecting the sector group, then industry and company.
Note: By selecting the “Go Big” Icon,  , in the upper-right corner of the panel, expands the amount of information and navigational icons.