
Search for answers or browse our knowledge base.
Trend Lines, Notes & Shapes and Advanced Annotations
Customize your charts with Trend Lines, Notes and Advanced Annotations.
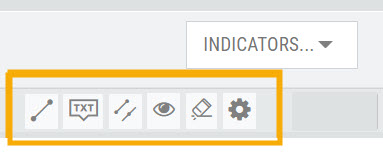
These tool icons are available above the chart, just below the Indicators drop-down box.
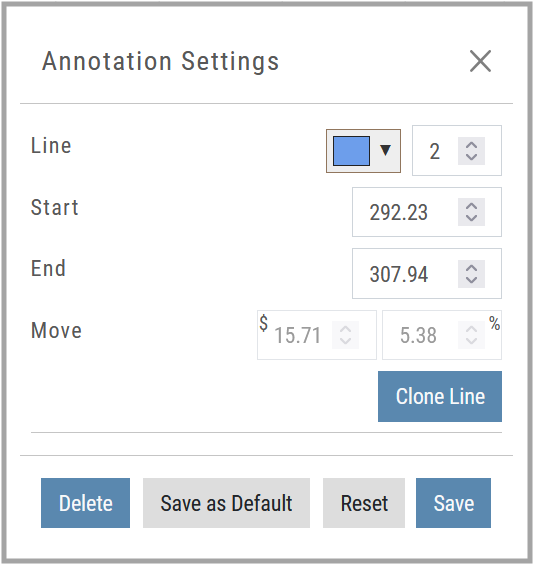
Each Annotation can have a Default Setting. This means all initially created lines, for example, will have the same settings, such as color and thickness.
Select your Annotation.
Draw it on the chart.
Click to display the dialog setting.
Adjust settings, then click “Save as Default.”
“Reset” will revert to initial settings.
You can still customize individual lines by saving the settings instead of saving as Default.
Fibonacci Too!
The Fibonacci Annotation has been enhanced to allow you to select which Retracement Levels you want to view, in addition to adjusting the color for each and the overall transparency.
The settings can be set as the Default for new chart entries or customize each entry, then “Save”.
**Please note: Existing Fibonacci annotations cannot be edited with this new coding. They must be deleted, then added back.
In addition, individual retracements can be extended Right and/or Left. Click the annotation on the chart to open the dialog box.
Note: The Extend Right/Left option cannot be set as a default setting.
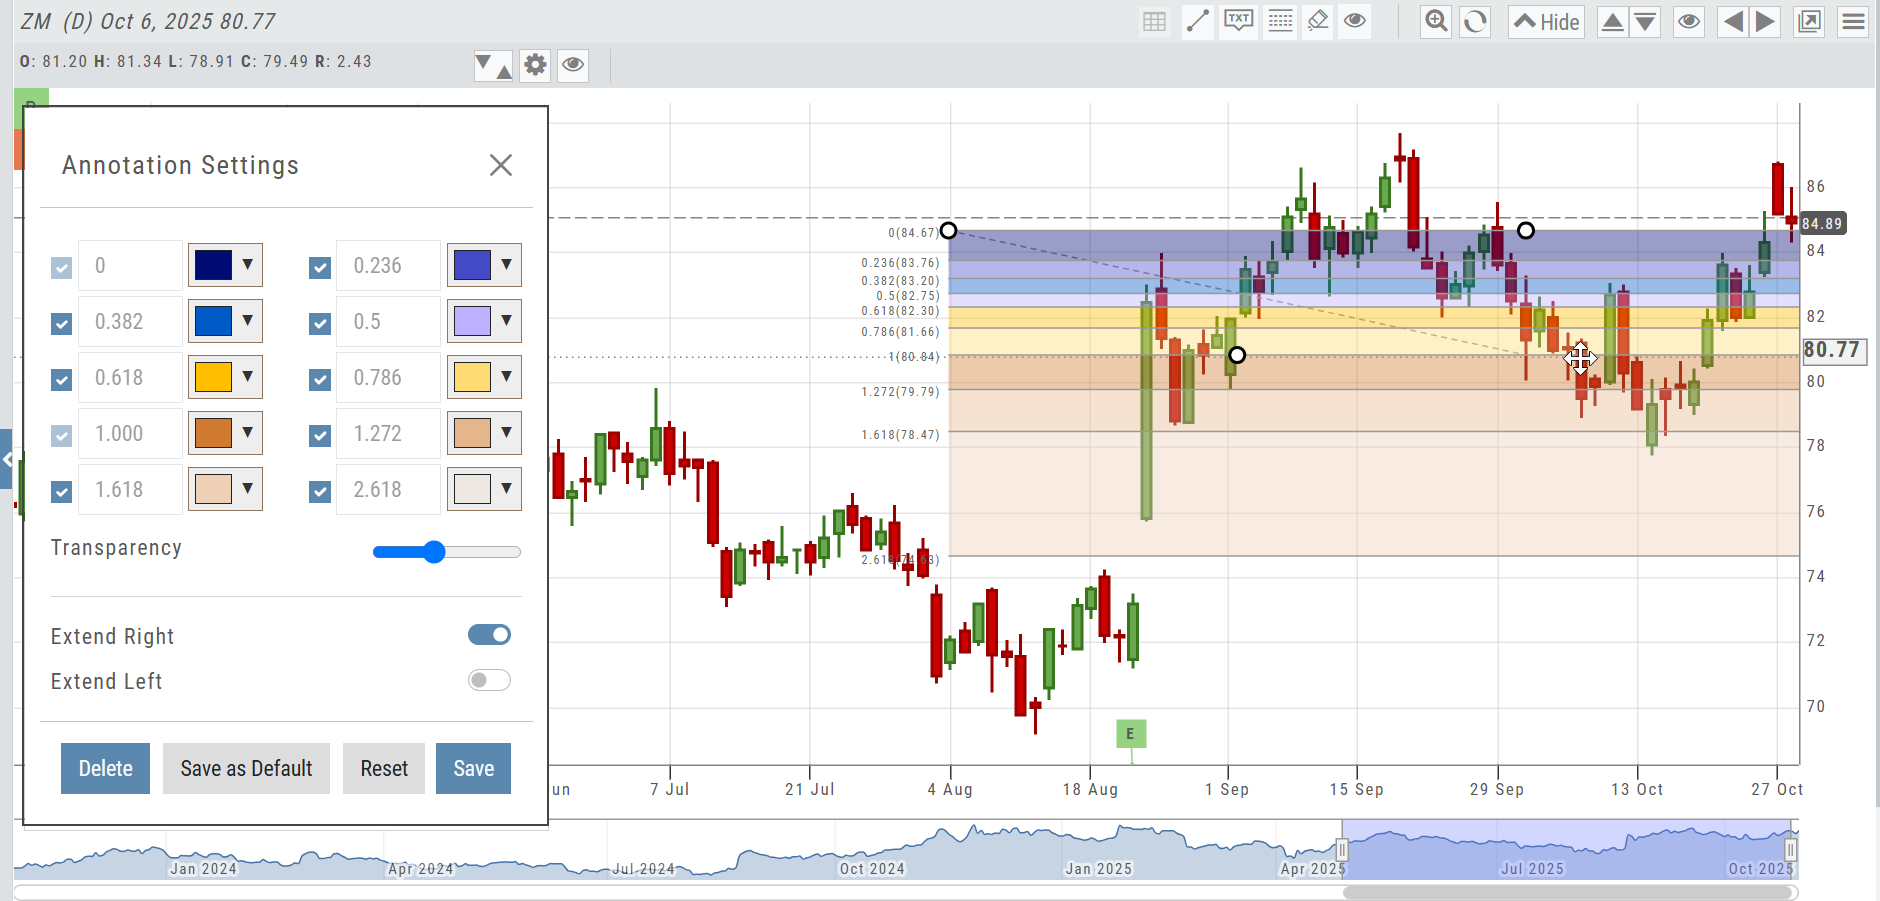
Clicking on any Trend Line, Note, or Advanced Annotation, will display the “Annotation Settings” box for that entry.
The Annotation Settings box can be repositioned elsewhere on the platform, if needed.
Line Color, Line Width and if applicable, Background Color and Transparency can be changed.
Be sure to click ‘Save’!
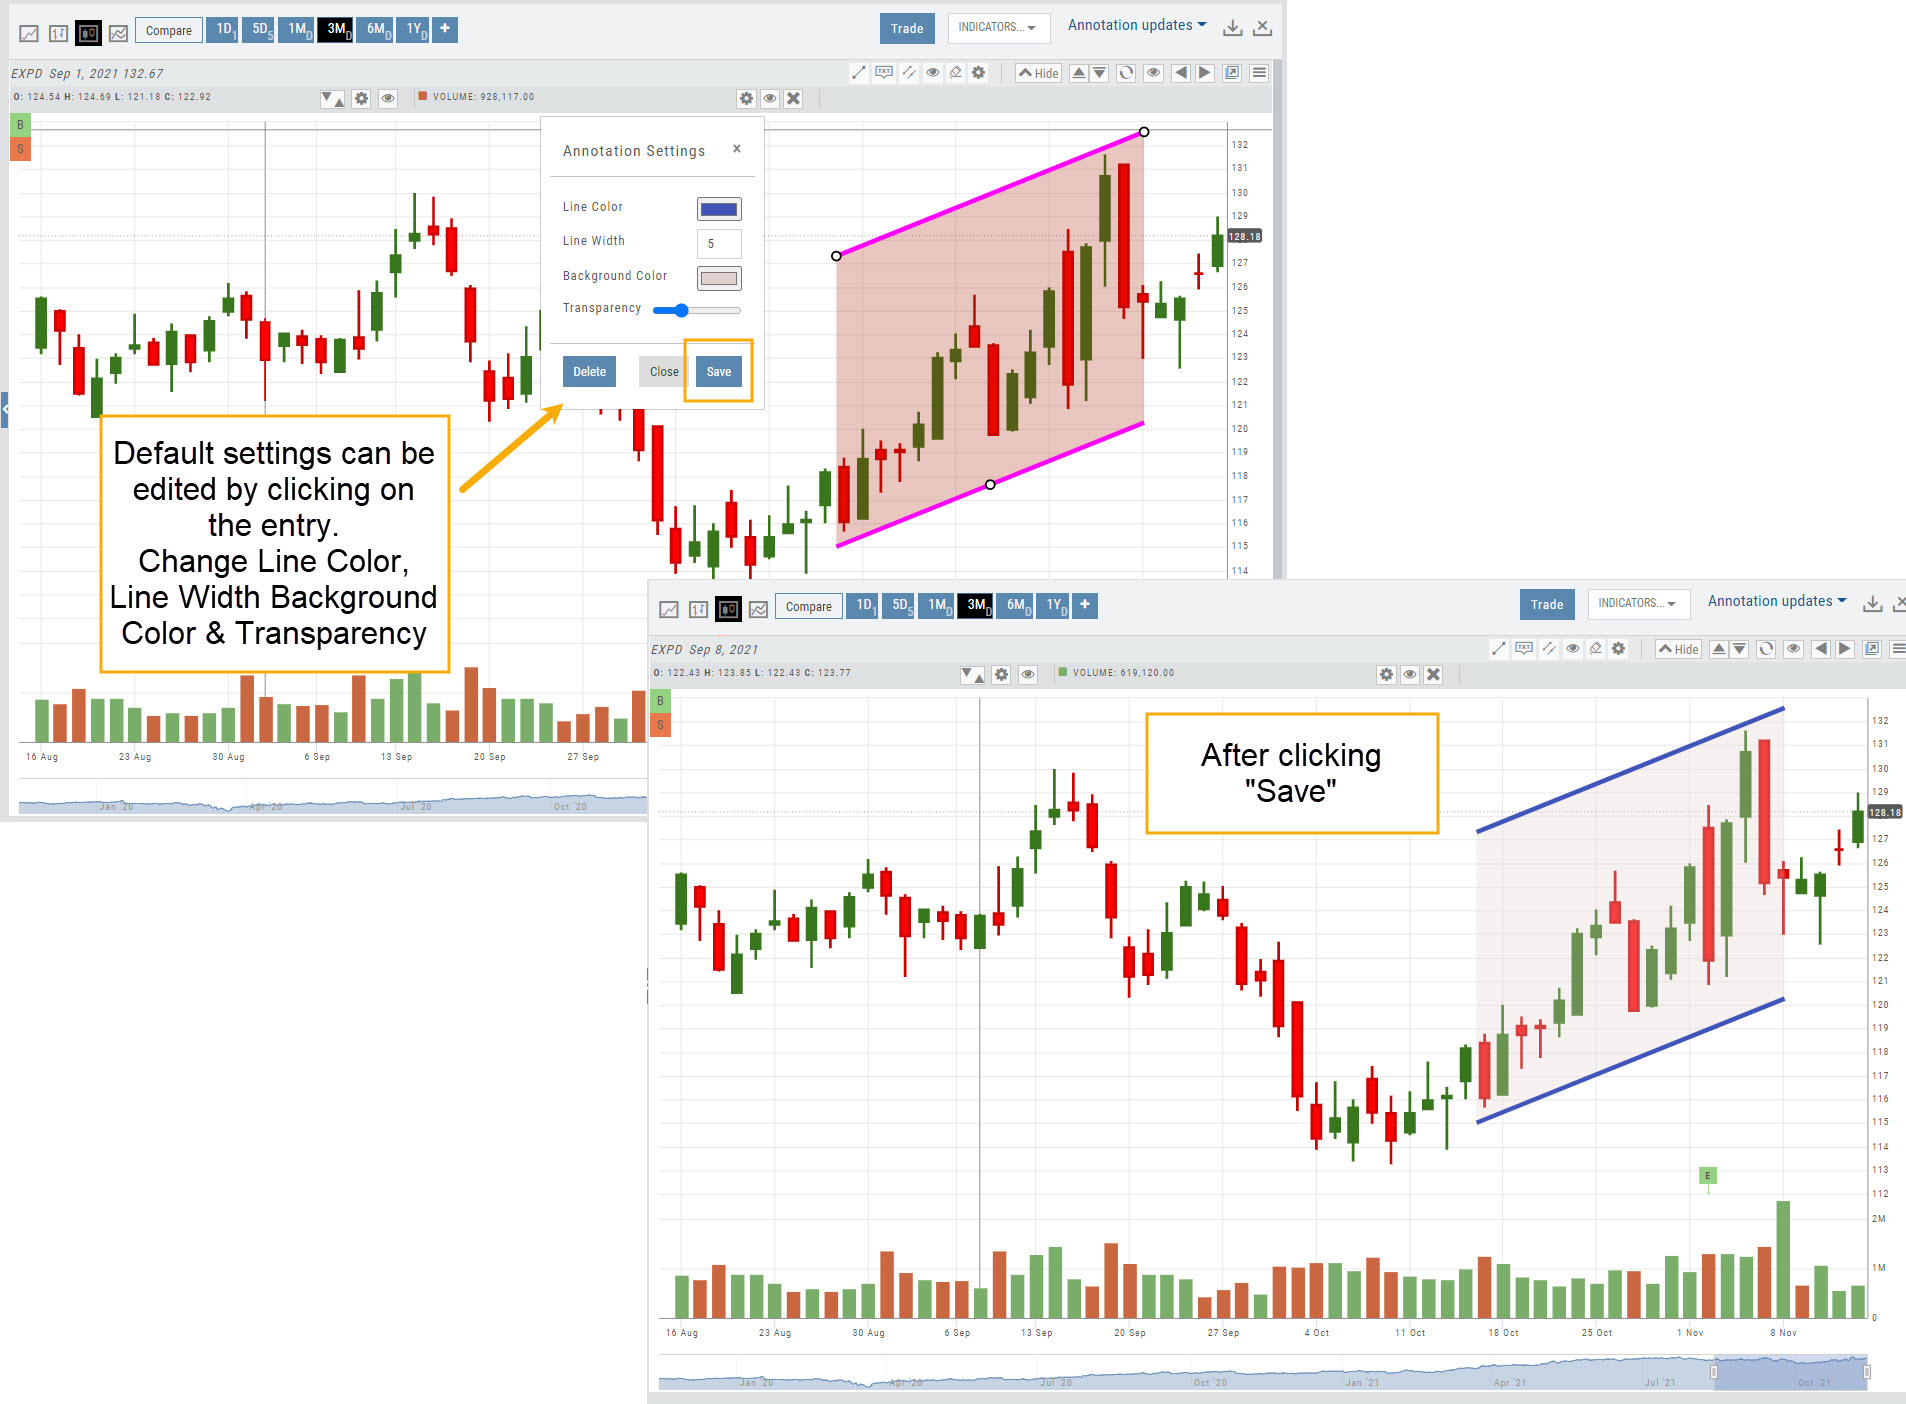
Note: Parallel channels are initially drawn horizontally. To change orientation click on the annotation then grab one of the ‘edit dots’ to drag to the position you wish.
Then click “Save” on the dialog box.
Click on graphic to view examples of editing the color/sizing

Click on graphic to view examples of moving and changing end points of charting annotations.
